Since I started using structured workouts, I wondered if, without a coach to look over your execution, is there a way to see how close your were with your execution to the target, especially when you have a more complex structured workout – because without the hints and the feedback the targeted workouts are not as useful as they could be – you could run freestyle no worries.
I remember the days when I was using my premium Training Peaks and saw the compliance level being displayed after completing the workout. Details are available here, but basically what they do is adding a color, using as criteria – planned duration, distance, or TSS:
- Green – Completed value is +/- 20% of planned values.
- Yellow – Completed value is 50%-79% or 121-150% of planned values.
- Orange – Completed value is more than 50% above or below planned.
- Red – Workout was not completed.
- Grey – Unplanned workouts (completed values with no planned values).
Also, FinalSurge has something similar, based on planned duration and planned distance, you can even define the colours for the highlights. Details are available here.
With the premium Stryd subscription, you can also see for your planned workouts how close you were to the prescribed power intervals and that’s nice as well.
Usually, my running power workouts adapted from a Stryd half marathon plan are reasonably simple, involving 4-5 steps, nothing fancy.

This kind of workout can be easily executed even on Garmin watches, without using anything else but the default structured workouts but not the target for steps, as it’s relatively simple to remember the target values/intervals for power for each steps – after all, there are only 4 types of steps.
It get’s a bit more complicated, when you have a more complex workout – then it’s not very easy to execute with the standard structured workouts as Garmin doesn’t support natively running power. There are some solutions, using FinalSurge or TrainingPeaks and executing with Stryd CIQ Workout app, or using some fancy CIQ fields in your running app, allowing the execution of structured workouts.
In my case, I was a bit stubborn and tried to use the standard Garmin structured workout, having the durations defined as steps and the intensity/target added as notes for each step.

When you try to execute this workout, it’s not that easy to understand actually how you done, especially if you only look in the Garmin Connect, also the Stryd PowerCenter doesn’t offer much more since the workout wasn’t declared in PowerCenter as a target.
My execution was 1h:6min:40sec, a bit less than what the target was, but basically I didn’t executed the full recovery step, that doesn’t change much the quality of execution in my view.
Then I decided to use my interest for data analysis and Python/Pandas to try to get more of this data. I downloaded the FIT file locally and started playing with a package – fitdecode – which is simple to use and works nice.
Fitdecode allows you access to the frames of the FIT file and their properties so you can extract the information you want to analyse in two data frames – one for points and one for laps.
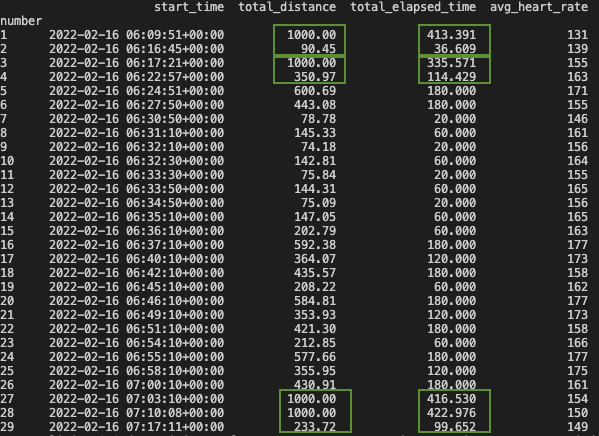
When I loaded the laps, I realised that I wasn’t so smart allowing the auto-lap feature on for my Garmin Fenix watch, because that added for every step of the workout which exceeded 1km one more lap every 1km, so I ended up with 29 laps 🙂
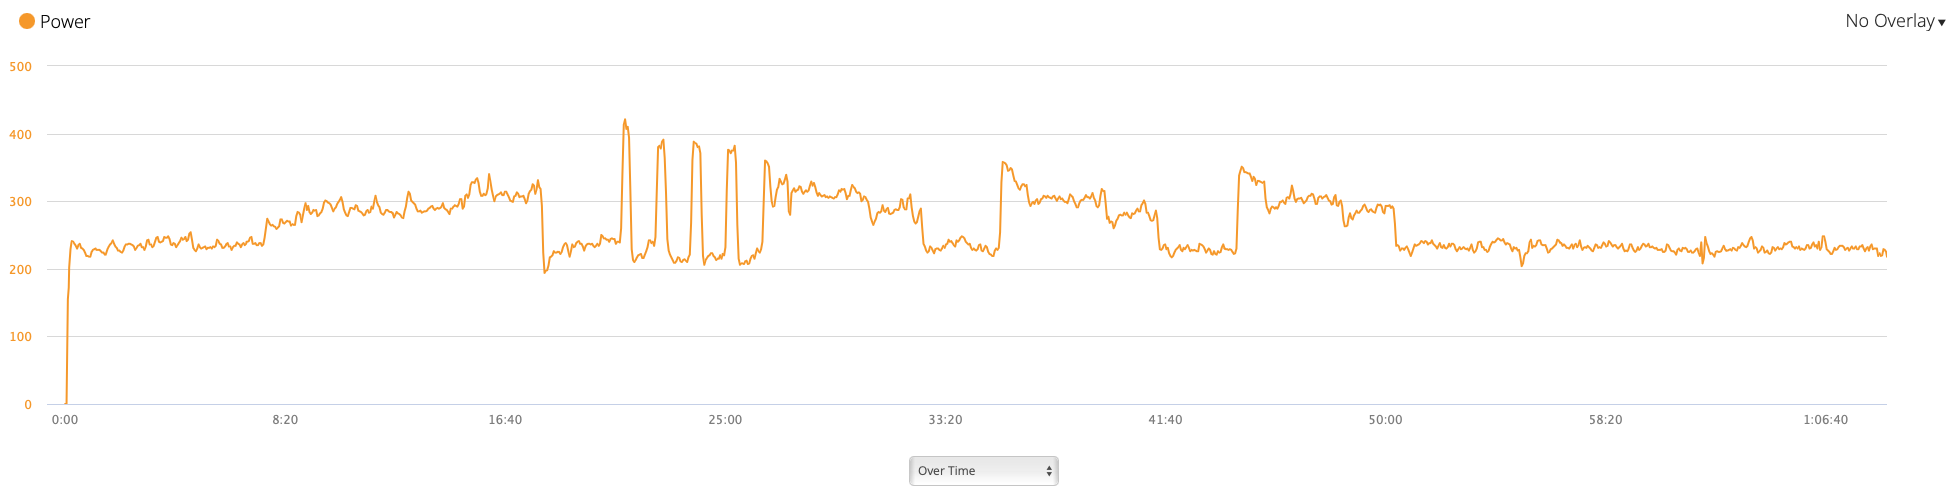
Using Matplotlib I managed to have an idea of how the data can be represented visually – for example the running power (W):

It confirmed what I already knew, that I overdid some of the “harder” steps, going way beyond the recommended upper limit, but I was just wandering by how much I over did it.
In terms of time spend outside of the ” target zone”, it was easy to add some columns in my data frame to perform the stats
# adds the limits columns based on phase number
points_df['phase_low_limit']=points_df['phase'].apply(lambda x:get_phase_limits(x)[0])
points_df['phase_up_limit']=points_df['phase'].apply(lambda x:get_phase_limits(x)[1])

# how many points with power under limit
points_df['under_limit']=points_df['Power']<points_df['phase_low_limit']

# how many points with power in limit
points_df['in_limit']=((points_df['phase_low_limit']<=points_df['Power']) & (points_df['Power']<=points_df['phase_up_limit']))

# how many points with power over limit
points_df['over_limit']=points_df['Power']>points_df['phase_up_limit']
There might be some other easier solutions to find out how much time I spent outside of the “target zone”, but I’m still learning Pandas, I’m not an expert by any means and I was happy with this approach.

If we look closer, at the phases, we may understand that I overdid the “sprints” or the more intense phases – it’s my overachiver drive .. do more and not less. I marked in the chart below the phases there were somehow more intense and my reaction was to over do it.
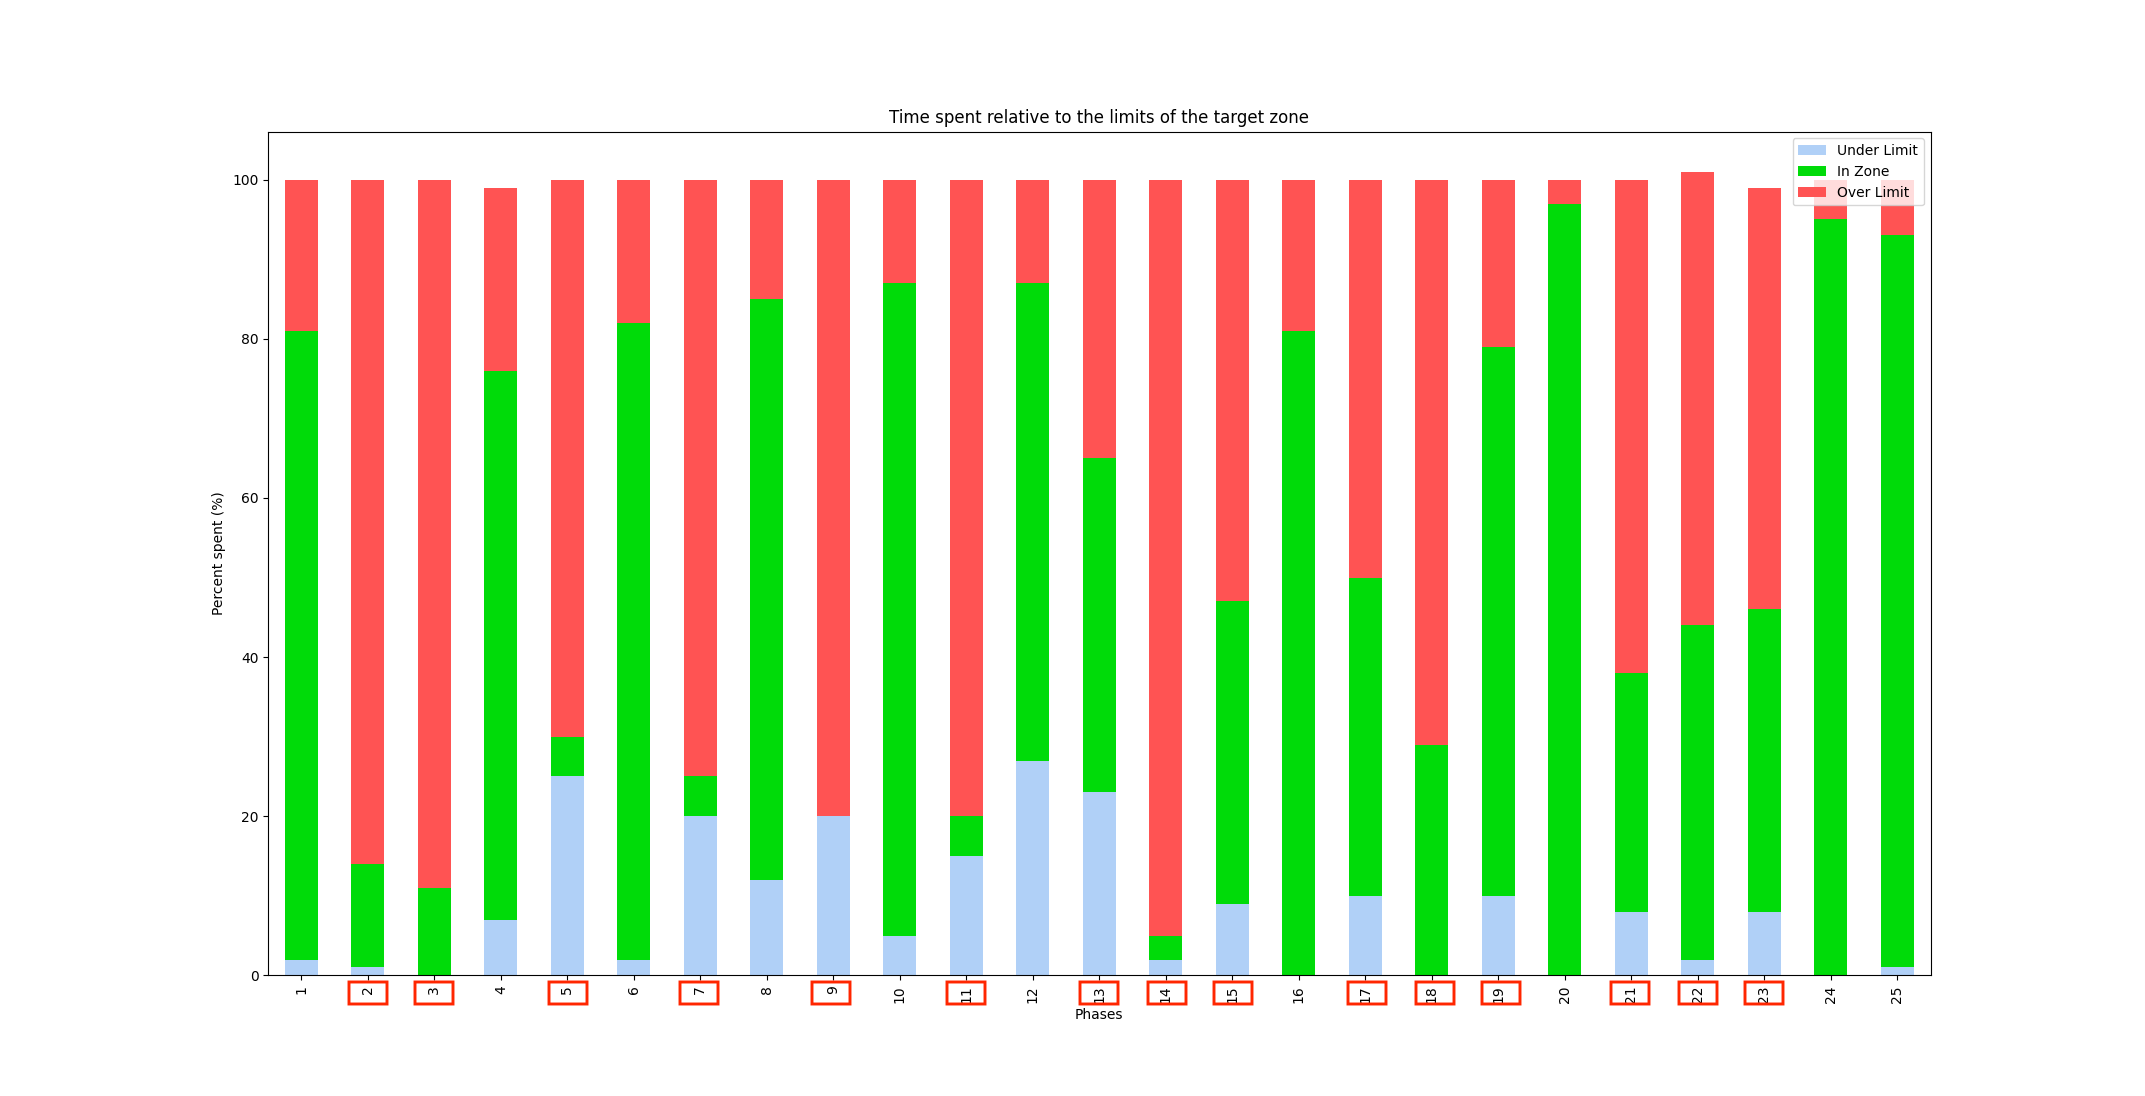
It’s true that not having the notifications regarding the under/over limit of the usual structured workouts, I could only look at the watch to see where I am relative to the target zone marked in my memory…maybe using the Stryd workout app would have saved some of the “over” time.
In terms of the actual work (if we would translate that into Joules), compared with the “ideal” execution when I’d have stayed for all phases at the average of the target zone and transitioned seamlessly from one phase to the other, the effort is 4.5% higher (1083.8kJ vs 1037kJ).
I don’t feel that this percent is huge, but in the context of the training session that means that my average running power was 4.5% higher, as if my CP was higher and not in a negligible fashion.
I hope that eventually Garmin will add native support for running power or if I want to train closer to the prescribed values, I should switch with other tools like Stryd Workout App.
Enjoy your running and learn new things every day!
Discover more from Liviu Nastasa
Subscribe to get the latest posts sent to your email.
