- The Memory Test
- From Memory to Method
- From Temperatures to Experiences
- The Last Generation of Old Summers
- Living in Romania’s New Summer (1996–2024)
- Romania’s Hidden Heat Map
- Romania in the Global Context
- What This Means for the Future
- From Doubt to Data
- Technical details & references
The Memory Test
Roman, a city in North-East of Romania, late 1980s. Summer evenings cooled down enough that you’d sometimes reach for a sweater (pushed most of the time by a protective grandma). Nights felt fresh, mornings could be crisp, and even the hottest days rarely went above 32–33 °C. When they did, it was an event— people adjusted their routines, but those days were exceptions, not the rule.
Fast forward to August 2025 in Otopeni, just north of Bucharest. I lie awake in my dorm, windows open, the night air still heavy and unmoving. I dislike air conditioning—its artificial chill and constant hum—so I try to endure the heat naturally. But the room doesn’t cool. Tropical nights, where temperatures refuse to drop below 20 °C, have become part of life. Forecasts now throw out numbers like 37 °C with barely a raised eyebrow. Last summer we had five days in a row above 35 °C, and nobody even blinked.
That contrast stuck with me. Was I idealising childhood summers, or has something fundamental shifted?
The question nagged at me until I stumbled across this HotNews article, which claimed that Romania’s hot days had exploded in frequency. The visuals were striking: Turnu Măgurele allegedly jumping from 3 hot days per year in the 1980s to 30 today. But the analysis compared only 1980–1984 against 2020–2024. Eight years out of a possible 45.
As any engineer knows, if you only sample 18% of your available data and call it a trend, your conclusions may be skewed.
So I asked myself: What story were the missing 36 years hiding?
That question set me on a journey—part memory check, part data investigation—leading from Romania’s restricted datasets to Europe’s open climate archives, and eventually to days of careful data gathering.
From Memory to Method
Childhood memories are notoriously unreliable. But climate data isn’t.
The Official Roadblock
My first instinct was simple: go to the source. Romania’s National Meteorological Administration (ANM) surely had the long-term temperature data for Roman and Otopeni.
They did—but not for me.
I quickly remembered something from an old project I’d worked on with them: these datasets aren’t freely available. They’re considered “protected” and typically sold to external partners. In other words, I couldn’t access them directly.
But also my memory served me well .. i remembered that the same measurements flow every day into European systems through international agreements. And sure enough, the Copernicus Climate Data Store had exactly what I needed: sixty-plus years of quality-controlled, gridded temperature data for Romania, free and open to anyone.
The European Route
That’s how I found the Copernicus Climate Data Store (CDS), the EU’s open climate platform. Within minutes I could see exactly what I had been denied locally: quality-controlled, gridded, daily climate data for Romania going back to 1960.
This wasn’t hobbyist weather logging or a commercial aggregator scraping websites. This was the backbone dataset used in official European climate assessments. In engineering terms, it’s the difference between a back-of-the-envelope estimate and the audited ledger.
The Download Marathon
Getting it, however, was not a single click.
🔬 For the Technical: The 40-Hour Data Marathon
- Authentication: Copernicus data isn’t just “click & go” — you need an API key to prove access.
- Chunking: A year of hourly temps is too big; I had to slice into 12 monthly downloads (x 65 years = 780 requests).
- Conversion & aggregation: Each file was Kelvin → °C, then rolled into daily min/max/mean.
- Integrity checks: Every daily file was validated for completeness (365/366 days) before being stitched into yearly sets.
- Resume safety: A manifest.json tracked success/failure so Colab could restart exactly where it left off after a disconnect.
- Persistence: Everything was streamed into Google Drive to survive Colab shutdowns
The CDS doesn’t hand over a giant file with “Romania, 1960–2024.” You need to request it month by month, 780 times over. Each monthly file arrived as a NetCDF of about 1 MB, which later aggregated into annual series of ~12 MB each.
That sounds small—until you repeat it across six decades and 65 years. By the time I was done, I had ~800 monthly fragments, neatly combined into 59 yearly files, amounting to a close to a gigabyte of daily climate history.
And because I was running this on Google Colab’s free tier, there was a catch: Colab politely disconnects you every few hours. Which meant I needed scripts smart enough to checkpoint progress, resume after crashes, and skip already-processed years.
Was it tedious? Yes. Did it matter? Absolutely. Because methodology isn’t decoration—it’s the difference between a trend you can trust and one you can’t.
The HotNews article that first triggered my curiosity wasn’t wrong to say Romania was heating up. But their method—comparing only 1980–84 against 2020–24—left 36 years of data on the cutting room floor. With cherry-picked start and end dates, you can tell almost any story you want.
You might wonder why I’m dwelling on these technical details. Because in climate discussions, methodology is everything. The original HotNews article wasn’t necessarily wrong about the trend, but their approach had several issues:
- Sample bias: Comparing 1980-84 vs 2020-24 cherry-picks the coolest recent period against the hottest, potentially exaggerating the trend
- Data quality: Commercial weather aggregators lack the validation and correction processes of official meteorological services
- Missing context: What happened during the other 36 years? Was the change gradual or sudden?
Using Copernicus data solved all three issues. The dataset includes every year since 1960, undergoes rigorous quality control, and combines observations from thousands of stations with physics-based models to fill gaps and correct errors.
Sometimes the best way to understand Romanian climate is to ask Europe.
But more importantly, anyone can verify my results. Every chart, every calculation, every conclusion in this analysis is reproducible. The same data is available to any curious parent, climate researcher, or skeptical engineer who wants to check my work.
Now, with 64 years of validated data in hand, I could finally test my childhood memories against reality. The results surprised me.
And the results were more dramatic than I expected.
From Temperatures to Experiences
Of course, nobody really experiences “daily mean temperature” in their lives. We feel the spikes, the extremes, the nights when the air doesn’t cool. Climate scientists know this, which is why they use a set of simple but powerful indicators:
- Hot days (SU25): days when the maximum temperature reaches at least 25 °C. Pleasant for a beach trip, but uncomfortable when it stretches on.
- Very hot days (SU30): when 30 °C is crossed, the heat starts to dominate daily life.
- Extreme hot days (SU35): what we casually call caniculă in Romanian—a heatwave day.
- Tropical nights (TR20): nights when the minimum temperature never falls below 20 °C. These are the nights when you can’t sleep well without air conditioning—or in my case, you endure with the windows open, waiting for a breeze that never comes.
These indicators matter more than abstract averages because they connect directly to human experience: how many nights you can’t sleep, how many afternoons you avoid going outside, how many summers feel “normal” versus oppressive.
📊 For the Technical: From Raw Data to Climate Indicators
- Libraries:
- xarray for handling decades of NetCDF grids
- pandas for reshaping, rolling averages
- numpy for fast number crunching
- ruptures for detecting structural breaks in warming trends
- Aggregation: Hourly → daily (tmin, tmax, tmean), then rolled up to yearly and decadal series.
- Indices: TR20 (tropical nights), SU25/30/35 (hot days), plus streak lengths for heatwaves.
- Trend detection:
- Linear regressions for °C/decade
- 20-year rolling averages to spot accelerations
- Piecewise regressions (with ruptures) to identify “turning points” like the early-2000s step change.
- Design choices: Used fan charts and highlight bands (like my “lived years” in Roman/Otopeni) to make abstract stats feel personal.
The Last Generation of Old Summers
Growing up in Roman in the 1980s, I thought I knew what summer meant. Hot days above 30 °C were newsworthy, rare enough that the evening forecast made a big deal of them. Nights cooled down, often enough to need a light sweater if you stayed out late.
The data now in my Drive lets me test that memory against reality.
- How often did Roman cross 30 °C in the 1960s, 70s, and 80s?
- When did 35 °C stop being exceptional and start being routine?
- And perhaps most telling, when did those cool evenings—the ones I still remember—actually disappear from the record?
The decade-by-decade averages confirm what memory suggested: summers in the 1960s, 70s, and 80s were noticeably cooler. In both the monthly means and the daily “fan” charts, you see a clear upward shift over time.

The curves for the 2010s and 2020s (highlighted in orange) consistently sit above the earlier decades (in muted blue). Summers that once peaked around 19–20 °C in monthly averages now exceed 21 °C, with winters also showing a slight lift (especially if you compare 1960s with the 2020s).

Roman’s climate baseline itself has shifted upward. What felt like a hot summer day in the 1980s is closer to an average summer day now.

When you count specific heat events, the change becomes starker. The heat indices chart shows:
- Warm days (≥25 °C) have roughly doubled in frequency since the 1980s.
- Very hot days (≥30 °C), once rare, are now common most summers.
- Extreme hot days (≥35 °C), almost unheard of during my childhood, now appear regularly.
- Tropical nights (≥20 °C) were essentially absent until the 1990s, but today occur 15–20 times in some years.
The type of days that defined “exceptional heat” in my childhood have now become routine.
The trend analysis underscores that this isn’t just linear warming. The piecewise regression detects a turning point around the early 2000s:
- Before 2000, Roman warmed at about 0.13 °C per decade—almost flat.
- Since 2000, the rate jumped to 0.79 °C per decade—a six-fold increase.

The 20-year rolling average tells the same story visually: the line stays almost flat across the decades I lived there (1978–1996), then bends consistently upward after the 2000s.

Together, these charts tell a story that’s both personal and generalizable: Roman’s summers really did change, and the pace of that change has quickened dramatically in the last 20 years.
Living in Romania’s New Summer (1996–2024)
When I left Roman in 1996 and moved to Bucharest, and later to Otopeni in 2005, I didn’t think of it as stepping into a new climate zone. But the data — and my lived experience — show that’s exactly what happened.

Compared to Roman, Otopeni is unmistakably warmer. The contrast is clear in the 2020s monthly comparison chart: winters are milder, summers hotter, and the overall curve has shifted upwards. What felt like a gentle, “continental” summer in Roman has become a prolonged season of heat and tropical nights in Otopeni.

And if Otopeni is hotter than Roman, the city center of Bucharest is hotter still. That’s not just perception — it’s the urban heat island effect at work. The Bucharest vs Otopeni monthly comparison shows Bucharest consistently running warmer by a few tenths of a degree, especially in summer. That might sound small, but it makes a real difference when it pushes nighttime lows above 20 °C, turning an uncomfortable evening into a sleepless night.

The TR20 comparison by decade makes this tangible: in the 2020s, Bucharest is logging almost 38 tropical nights per year, compared to about 35 in Otopeni. Not a huge gap, but enough to be felt when you’re trying to cool a bedroom without air conditioning.

Now, coming back to the Otopeni status, the daily and monthly “fan” charts show the same trend like for Roman. Everything is going upwards.

In Otopeni, the shift isn’t gradual — it’s obvious. The monthly profiles for the 1960s–1990s hug close together, forming a baseline of “old” summers. Then, starting in the 2000s, the whole curve lifts. By the 2010s and 2020s, July and August are a full 2–3 °C hotter than the climate I grew up with in Roman.
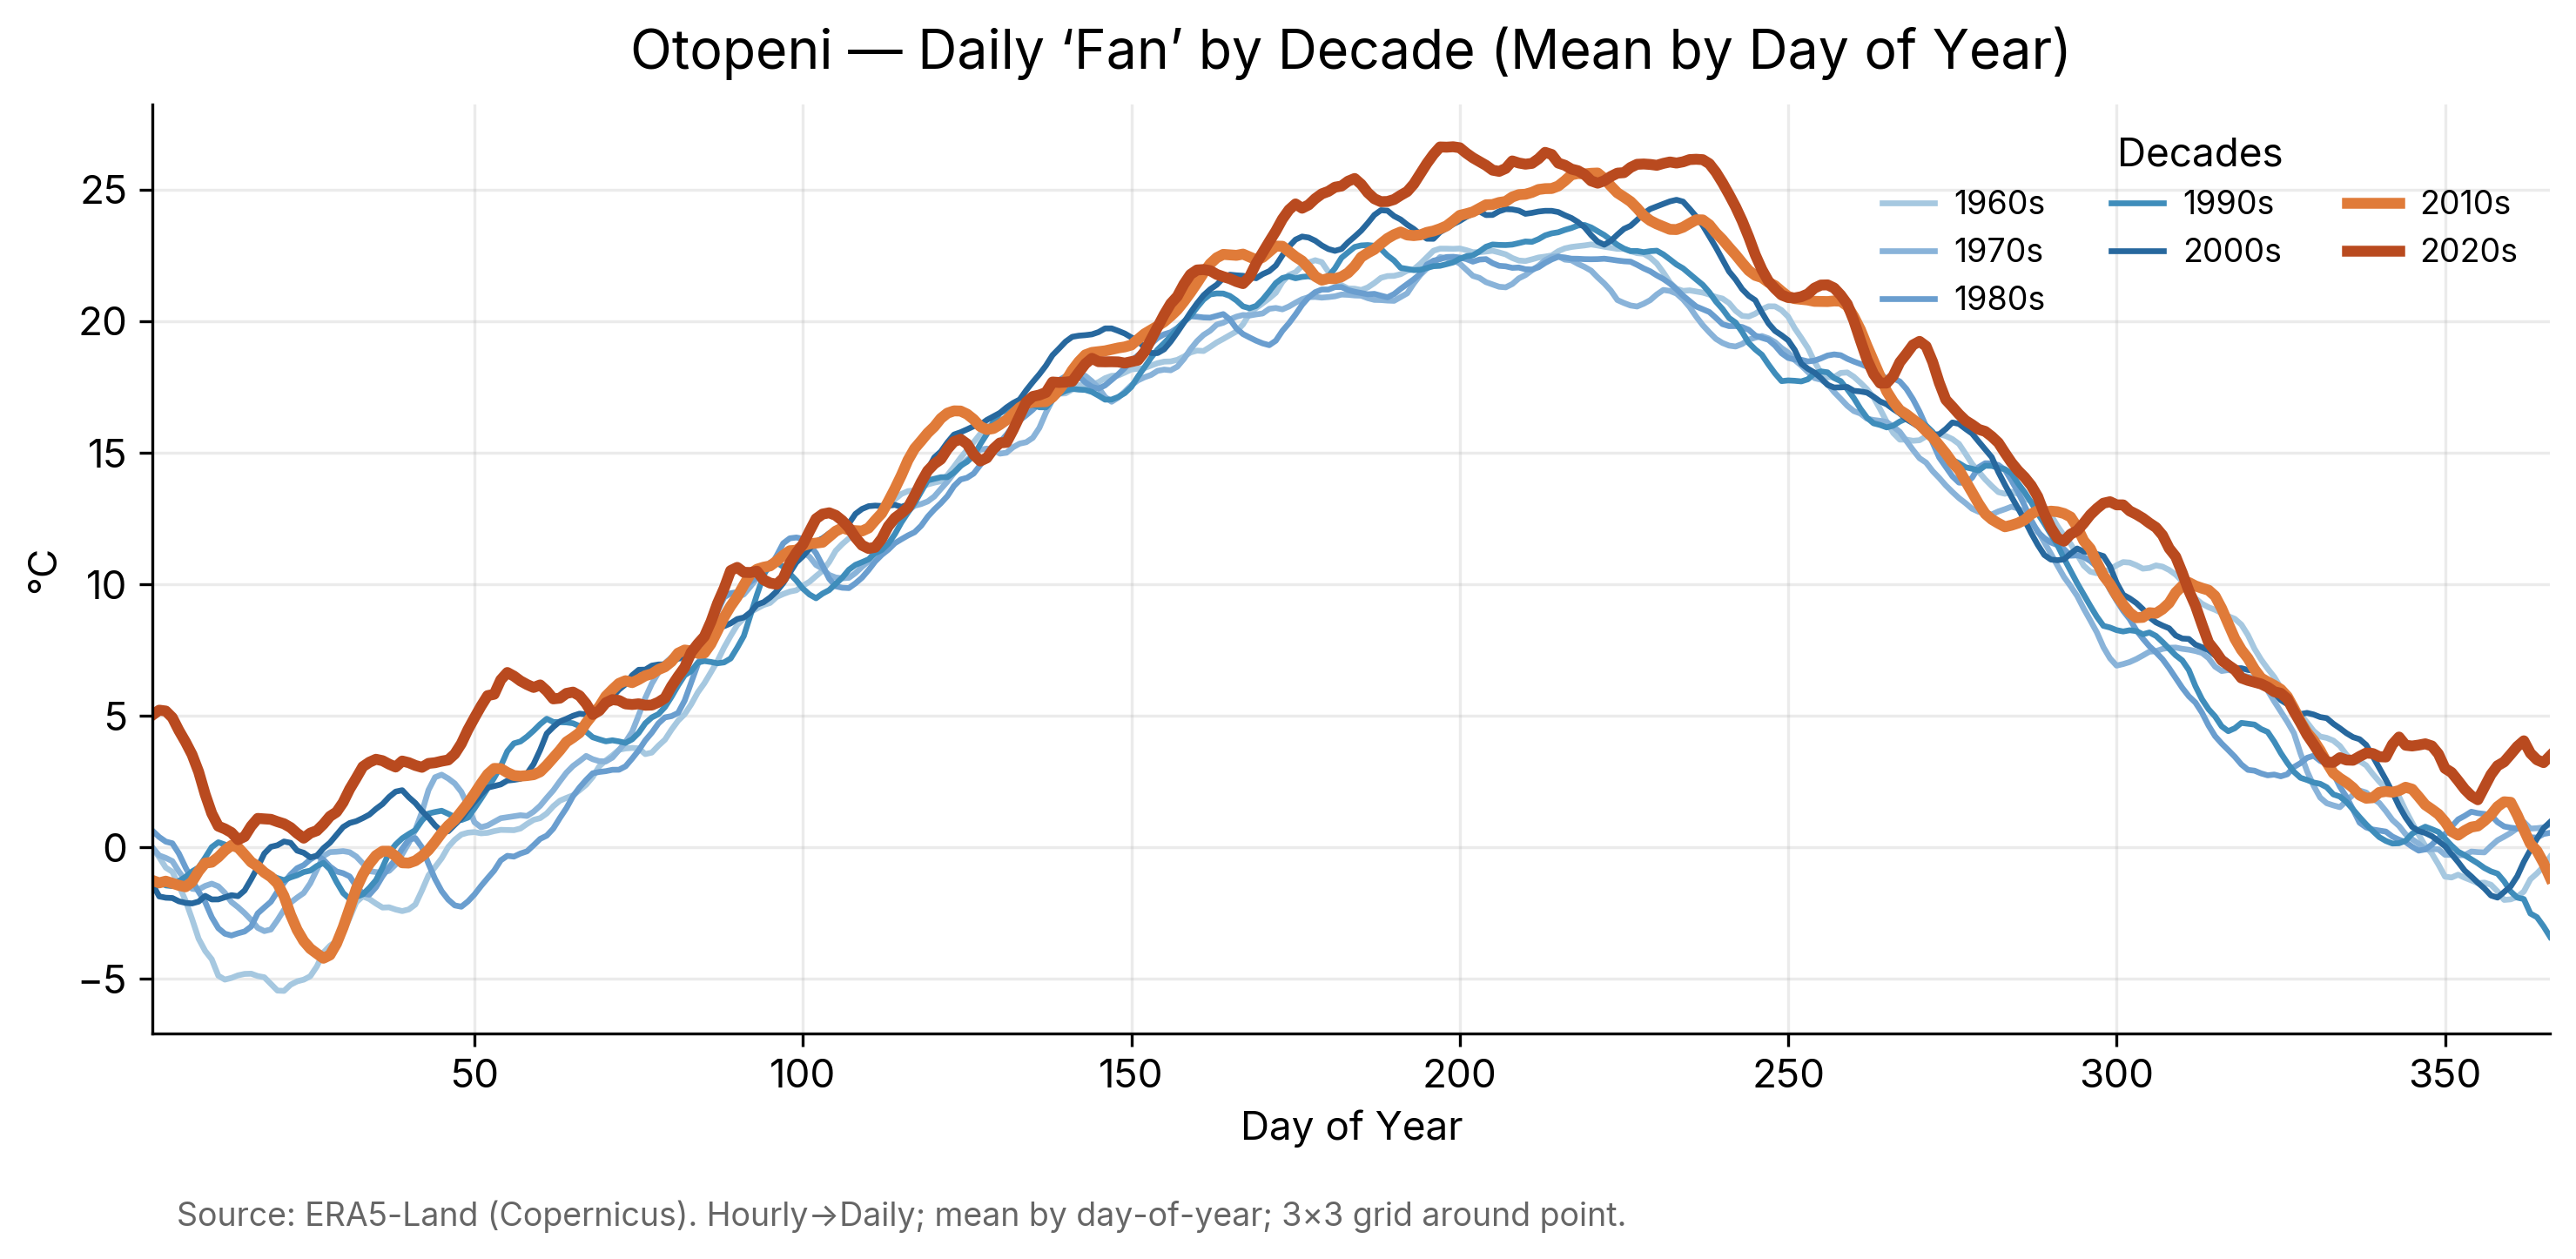
This “fan” chart makes the new normal unmistakable. What was once a gentle arch — hot in July, cooling by late August — is now stretched wider, staying hot later into September. Even January and February are warmer than before, confirming what anyone living here feels: there are fewer crisp, cold winter days, and summers drag on.
The rolling 20-year mean ties this to lived experience: when I moved to Otopeni in 2005, I entered the steepest part of the curve. My adult years have overlapped precisely with Romania’s fastest period of warming.
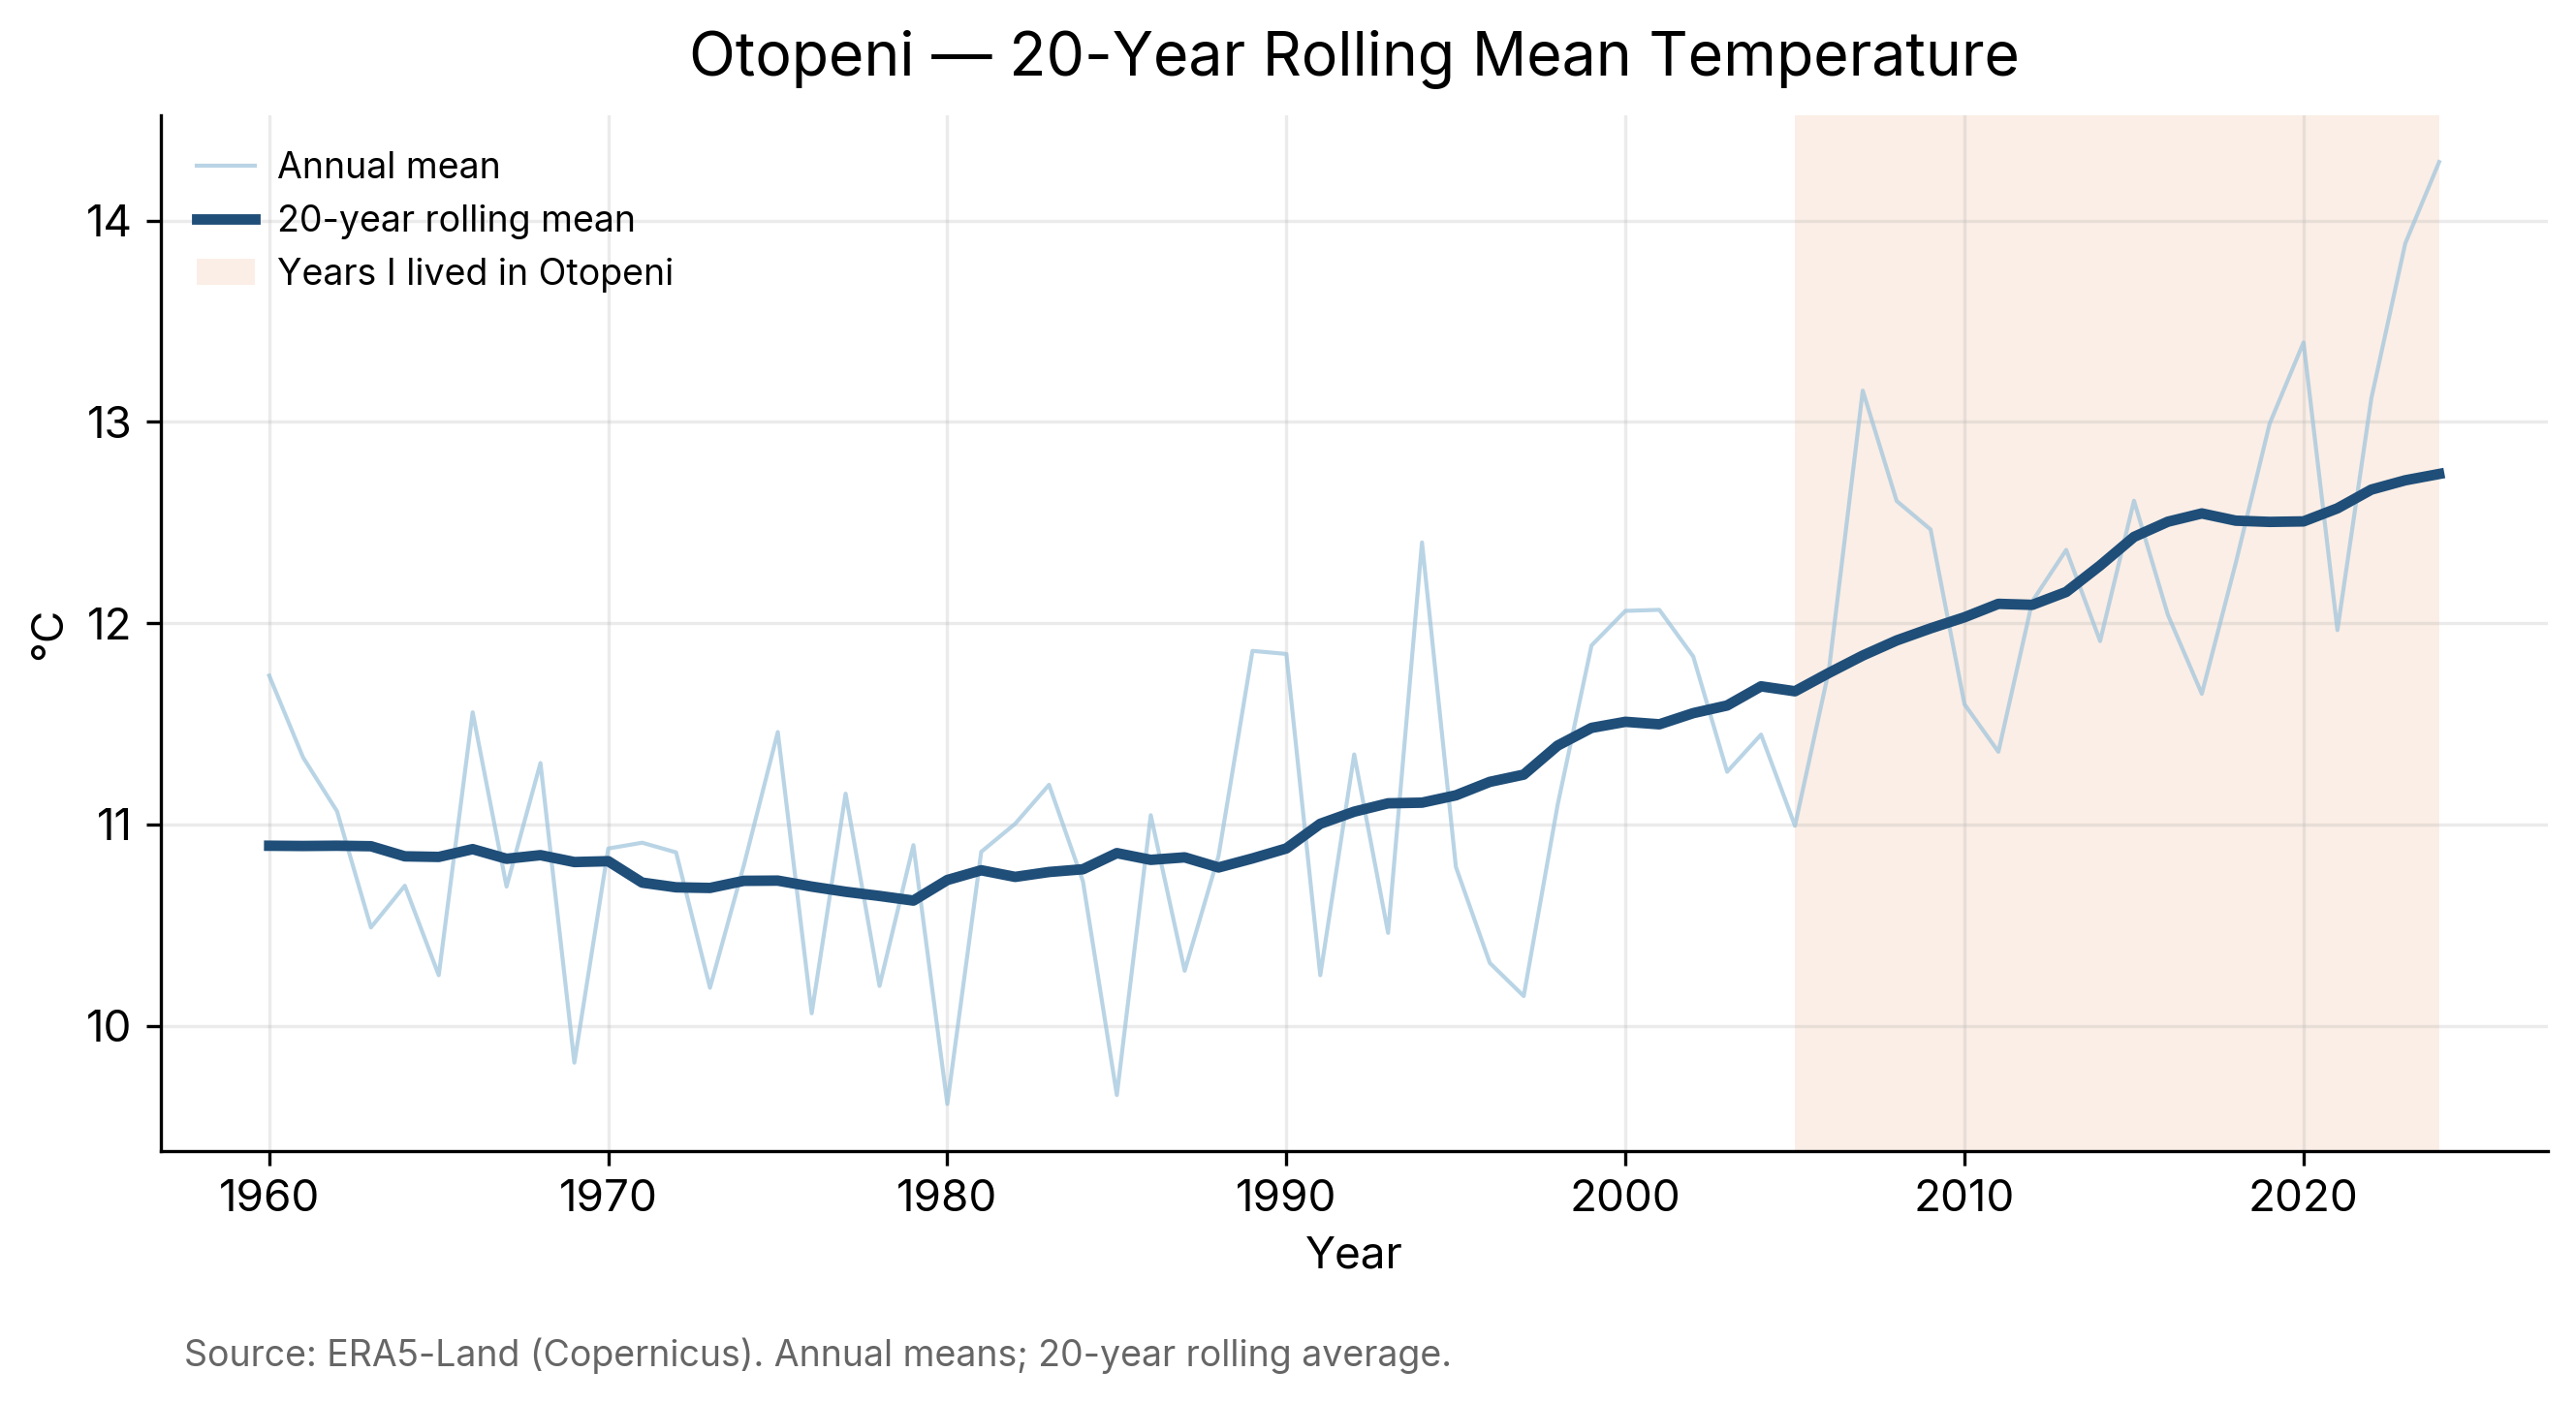
Long-term trends reveal the acceleration point: while Roman shifted around 2000, Otopeni’s piecewise trend analysis shows the same pattern — a relatively flat trend until the late 20th century, followed by a sharp rise from the early 2000s. The warming rate since then has been almost 0.8 °C per decade, more than seven times the pre-2000 pace.
📊 For the Technical: Statistical Significance
- Trend detection: Linear regressions were fit on annual/decadal averages. Breakpoints (change points in warming speed) were detected using the ruptures library with piecewise regression.
- Confidence intervals: Change points were identified within ±2 years, giving robustness to the “early 2000s acceleration.”
- Significance testing: Warming trends were tested at the 95% confidence level (p < 0.05).
- Rates:
- Roman: +0.6 – 1.0 °C/decade (95% CI) since 2000
- Otopeni: +0.6 – 0.9 °C/decade (95% CI) since 2000
- Why it matters: This ensures that the apparent “faster warming since 2000” isn’t a visual illusion, but a statistically significant shift in Romania’s climate data.

Heat indices (SU25, SU30, SU35, TR20) make the change concrete:
- Warm days (≥25 °C) have become the norm, not the exception.
- Very hot days (≥30 °C) now stack up to a month or more each year.
- Extreme hot days (≥35 °C) appear regularly, something Roman barely saw.
- Tropical nights (≥20 °C) have multiplied, eating away at recovery time.

The 2020s Roman vs Otopeni comparison shows just how different the two places now feel:
- Otopeni has 30–40 more warm days each year.
- Very hot days (≥30 °C) are nearly triple.
- Tropical nights are commonplace in Otopeni but rare in Roman (although not that much anymore).
This explains why the summers of my childhood in Roman felt bearable without air conditioning, while in Otopeni, keeping cool has become a daily negotiation with the thermostat.
Roman represents “the last generation of old summers”, while Otopeni represents “the new climate reality”. The inflection point around the 2000s marks not just a statistical change, but a personal one: the summers I live through now are fundamentally different from those I grew up with.
Romania’s Hidden Heat Map
Zooming out to the national level, we can analyse the evolution of the mean temperature for example and there is a change in dynamic.
🗺️ For the Technical: Spatial Analysis Methods
- Libraries:
- geopandas for county shapefiles & geometry joins
- regionmask to map ERA5 grid points into county boundaries
- numpy for cosine latitude weighting (bigger cells near the equator, smaller near the poles)
- matplotlib / cartopy for clean, publication-style maps
- Process:
- Each daily grid cell was matched to its county using regionmask.
- Area-weighted means were calculated per county, per year, to avoid bias from large vs. small counties.
- From there, indices (TR20, SU35, etc.) were aggregated by decade.
- Visual design:
- Sequential color scales for clarity (OrRd for nights, YlOrBr for hot days).
- Dark-grey borders for counties, scaled legends, and compact horizontal colorbars for readability.
- Labels added for outliers (fastest- and slowest-warming counties).
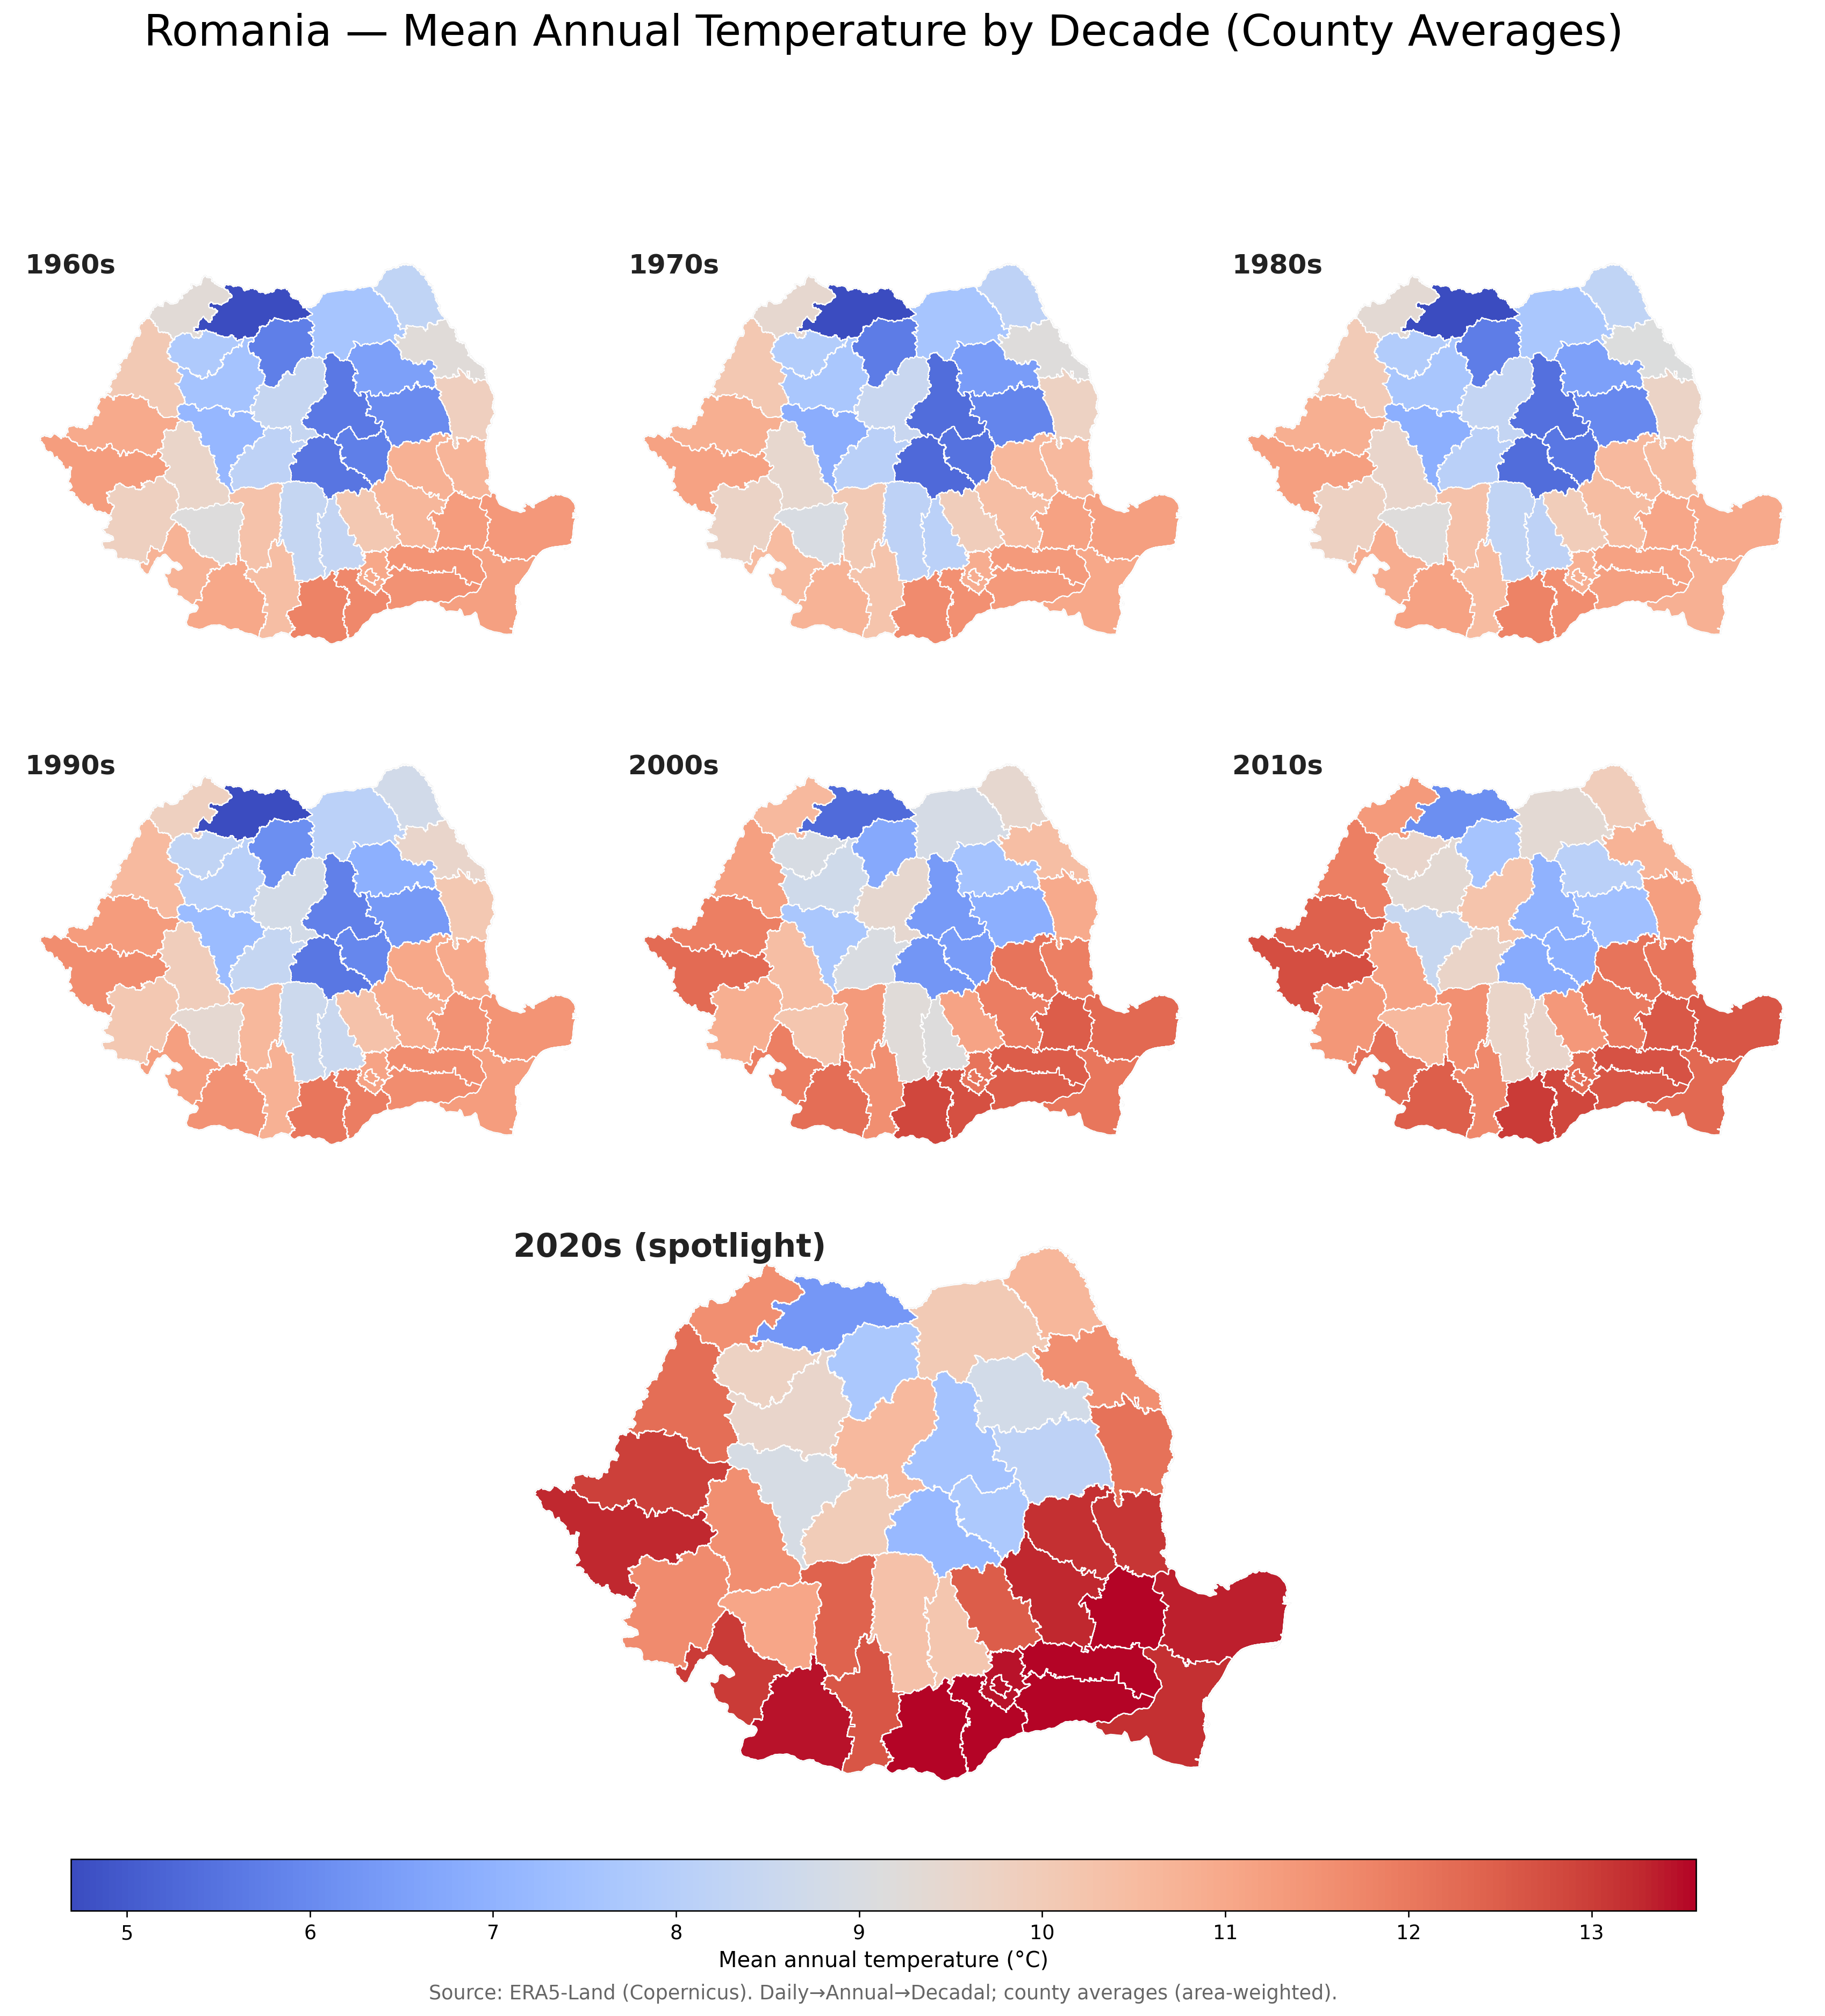
When you look at the county-level maps across decades, a very clear story emerges.
In the 1960s–1980s, most of Romania was in the “cool spectrum,” with annual means often below 9 °C in the center and north, and only the southern plains and Dobrogea standing out as warmer. By the 1990s, warming begins to creep in, but the country still retains a cooler backbone across the Carpathians. Starting in the 2000s, the shift accelerates: warm colors spread across Oltenia, Muntenia, and Dobrogea, while the cooler zones shrink into higher elevations. The 2010s consolidate this trend, and by the 2020s the map is transformed — the south and southeast are firmly in the deep red, with mean annual temperatures exceeding 12–13 °C. Even the historically cooler counties of the north and center have warmed into ranges that used to be typical only for the south.
Romania as a whole has warmed, but the lowlands and especially the south have become hotspots. In practical terms, the climate baseline my generation grew up with in the 1980s has shifted by 2–3 °C in just a few decades.

In the Romania of the 1960s, tropical nights — when the minimum temperature never dropped below 20 °C — were almost unheard of. Most counties averaged close to zero such nights per year, with a few along the Black Sea coast and in the far south seeing only the occasional warm night.
Through the 1970s, 1980s, and even the 1990s, the pattern remained relatively stable: tropical nights were an exception, confined mainly to the southeast and coastal areas. But something shifted as the 2000s began. The number of hot nights surged, first in southern counties, then spreading north and west.
By the 2010s, tropical nights were no longer an anomaly but a regular summer feature in much of the country. And in the 2020s, the spotlight map makes the shift unmistakable: large areas of southern and southeastern Romania now average more than 30 tropical nights per year — effectively an entire month of nights too hot for natural nighttime cooling.
This matters because tropical nights are more than just a discomfort. They are a direct marker of heat stress on human health, agriculture, and energy demand. When nights no longer bring relief, the body struggles to recover from daytime heat. Air conditioning becomes not a luxury but a necessity, driving up electricity use and amplifying the urban heat island effect in places like Bucharest.

While tropical nights tell us about discomfort and lack of relief, SU35 days (when daily maximum exceeds 35 °C) reflect the intensity of heat during the day. These are the “scorchers,” the days when outdoor work becomes risky, crops suffer, and energy demand spikes.
- 1960s–1980s: Such days were rare almost everywhere. In most counties, you could go through an entire summer without crossing 35 °C more than once or twice. The maps for these decades are almost uniformly pale, with only the southern plains (Oltenia, Muntenia) showing the occasional spike.
- 1990s: A first visible shift. Southern and eastern counties (Teleorman, Giurgiu, Ialomița, Constanța) start to show a cluster of SU35 days, with averages creeping up to 2–3 days per year.
- 2000s–2010s: The pattern intensifies. The southern belt of Romania (from Dolj through Giurgiu and eastward to Constanța) emerges as the country’s heat epicenter. Here, SU35 days jump to 5 or more per year on average — a figure unimaginable just a few decades earlier.
- 2020s spotlight: The acceleration is undeniable. The southern half of the country now routinely sees 6–7 very hot days per year, with some counties flirting with even higher averages. What was once exceptional is fast becoming a new normal in large parts of Romania.
Romania isn’t warming uniformly. Geography matters – and the maps make it clear.
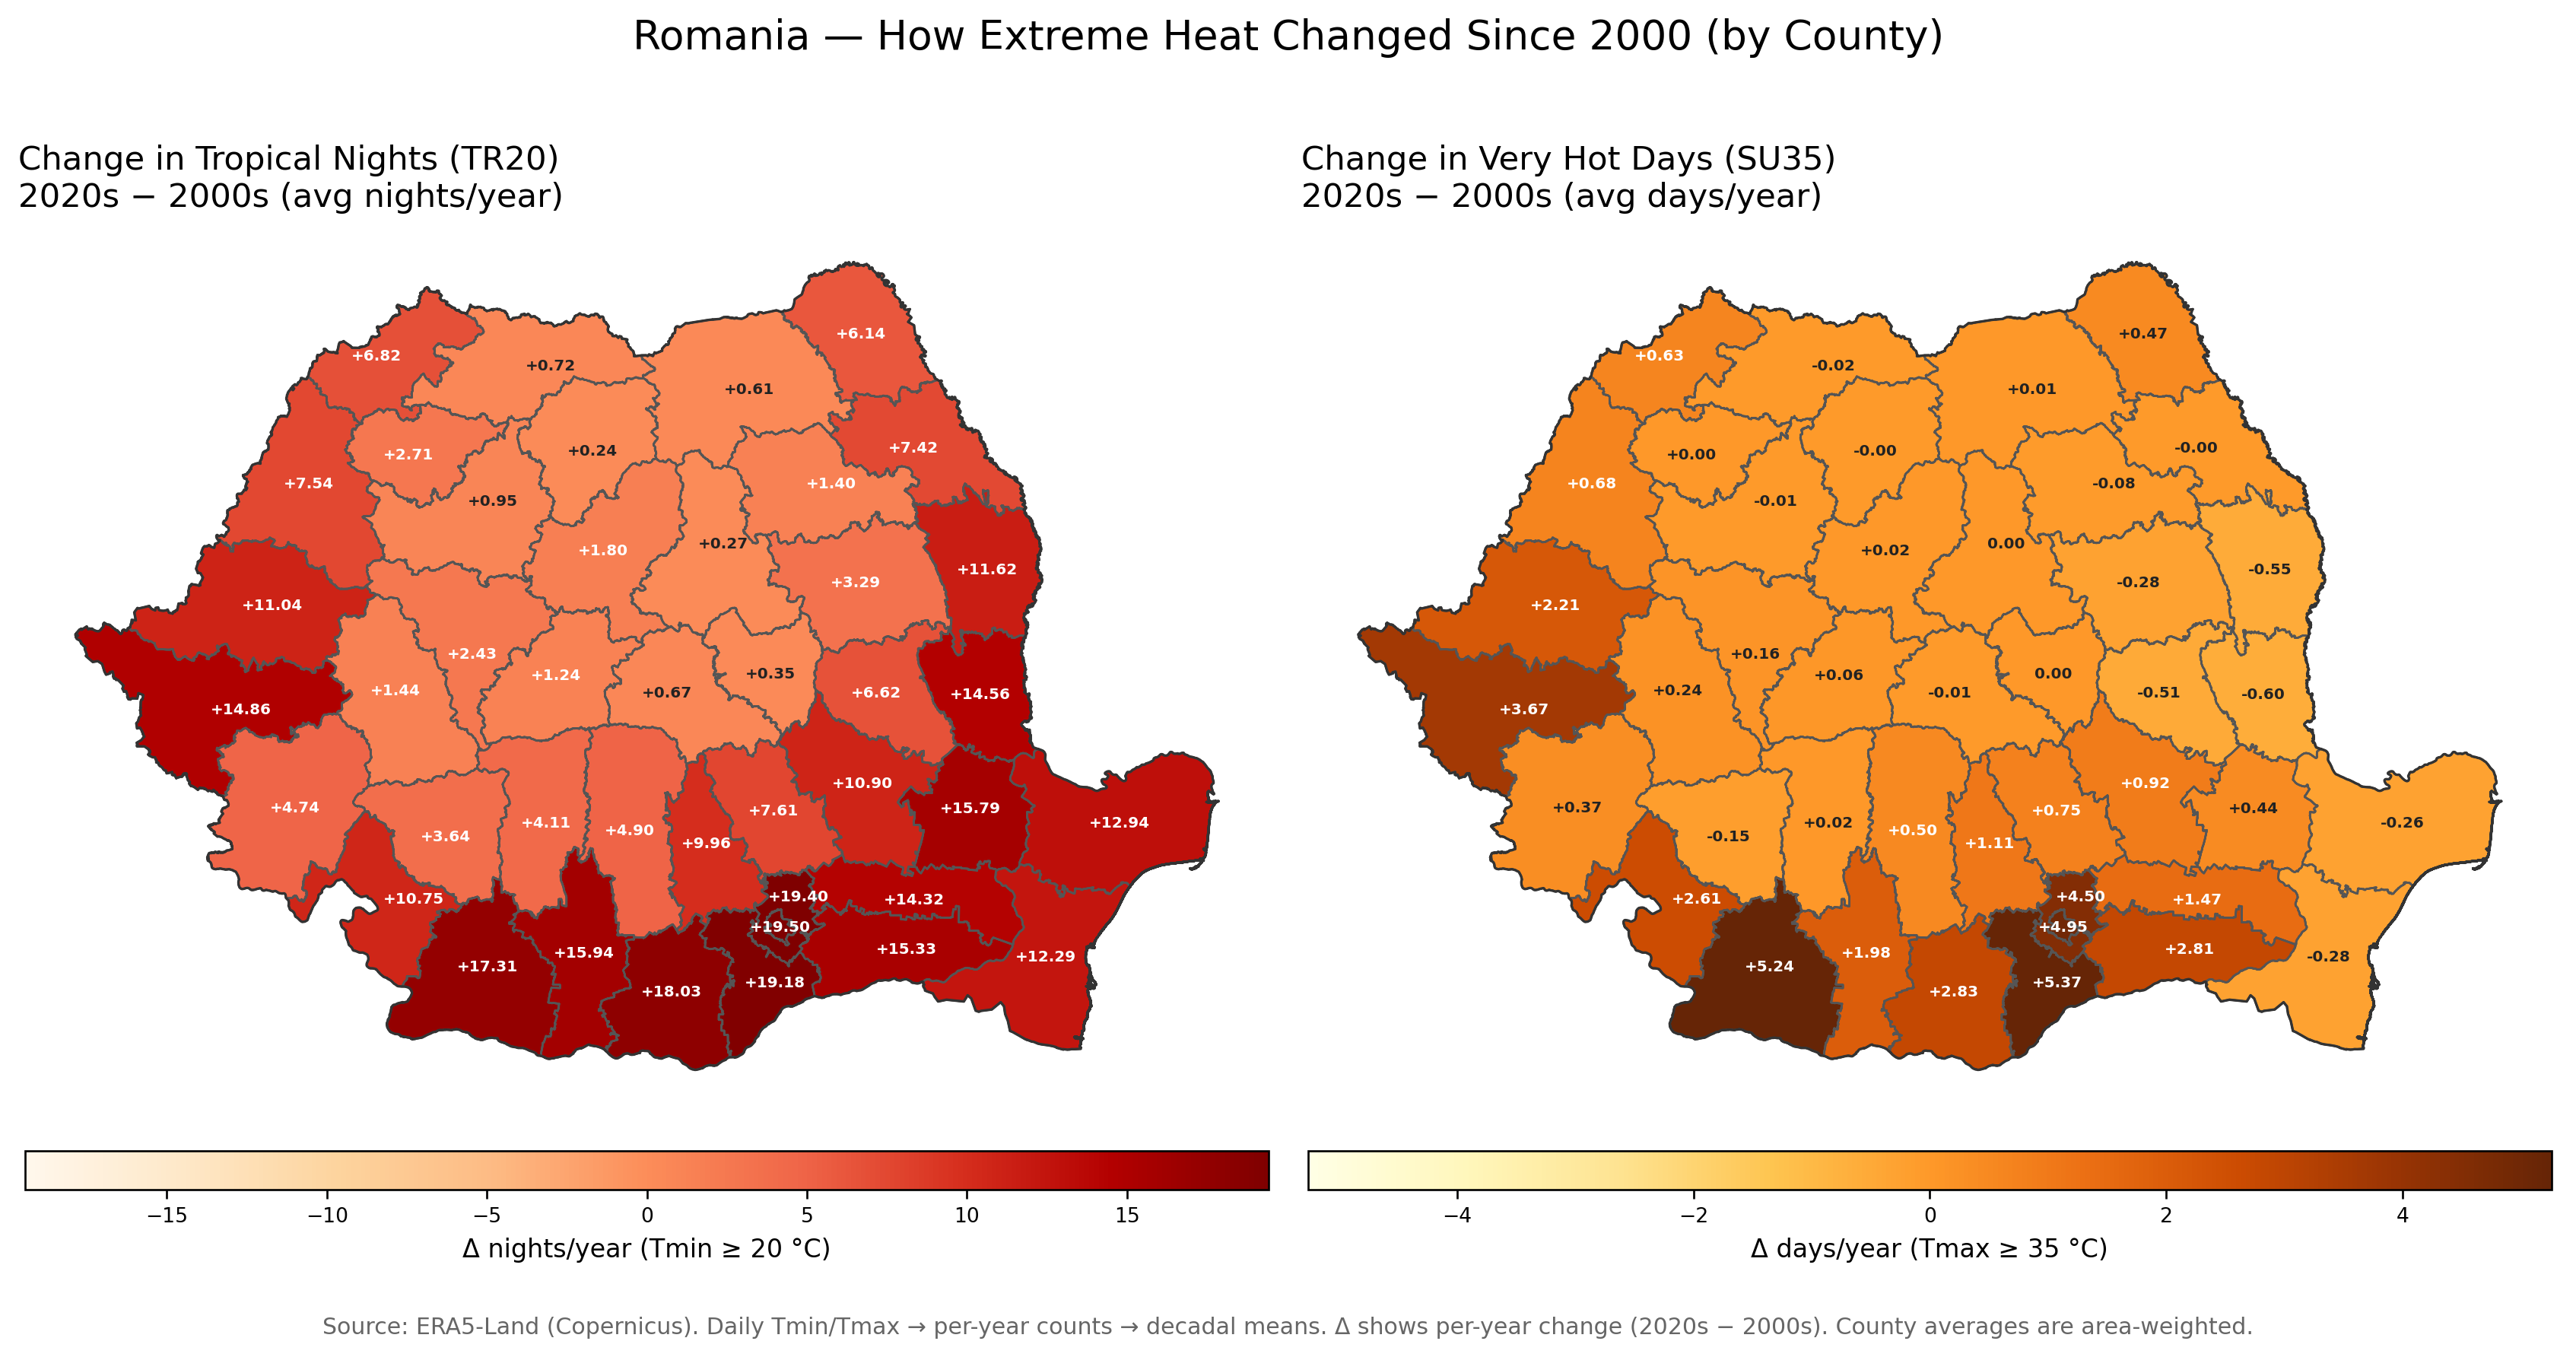
On the left (TR20 – Tropical Nights):
Nights with minimum temperatures above 20 °C used to be rare outside Bucharest or the south. But since 2000, entire swaths of the country — especially Oltenia, Muntenia, and Dobrogea — have added 15–20 extra tropical nights per year. That means an extra 2–3 weeks every summer where nights no longer bring relief. Even traditionally cooler counties like Iași or Timiș now see 10+ more hot nights compared to the 2000s.
On the right (SU35 – Very Hot Days):
The story is similar for extreme daytime heat. Southern counties such as Dolj, Olt, Teleorman, and Giurgiu are experiencing 4–5 more days above 35 °C each year. Western and northern counties, while less affected, are not immune — some have shifted from near-zero to a regular handful of such days each summer.
As we have seen in the previous charts, the 2000s were a inflection point and a hot decade, but still, you can see the dynamic/speed of change especially with Tropical Nights by analysing the variation of the number of days as a trend in the chart below:

A trend-based view confirms the broader story: since 2000, southern and eastern Romania consistently see the fastest rise in tropical nights and very hot days, while northern counties remain comparatively stable
Romania in the Global Context
The patterns I found in Roman, Otopeni, and across Romania’s counties don’t exist in isolation. They mirror — and in some cases amplify — a broader continental trend. According to the European State of the Climate 2024, Europe has been warming at roughly twice the global average since the 1980s, making it the fastest-warming continent on Earth.
Within Europe, southeastern countries like Romania are among the hardest hit. Copernicus data shows a marked rise in tropical nights and extreme-heat days across this region, driven by a mix of geography and climate dynamics: more frequent summer heatwaves, reduced masking from aerosol pollution, and the continent’s exposure to Arctic amplification. Romania sits right in this transition zone — which explains why changes here feel so abrupt. The sleepless nights and blazing days are not just local quirks of weather, but part of Europe’s new climate reality.

(Source: Copernicus Climate Change Service/ECMWF, 2024)
Figure above (Copernicus, 2024) shows how all four seasons in 2024 were warmer than the 1991–2020 average across most of Europe. Romania and its neighbours stand out, particularly in summer and winter, where anomalies exceed +2 °C.
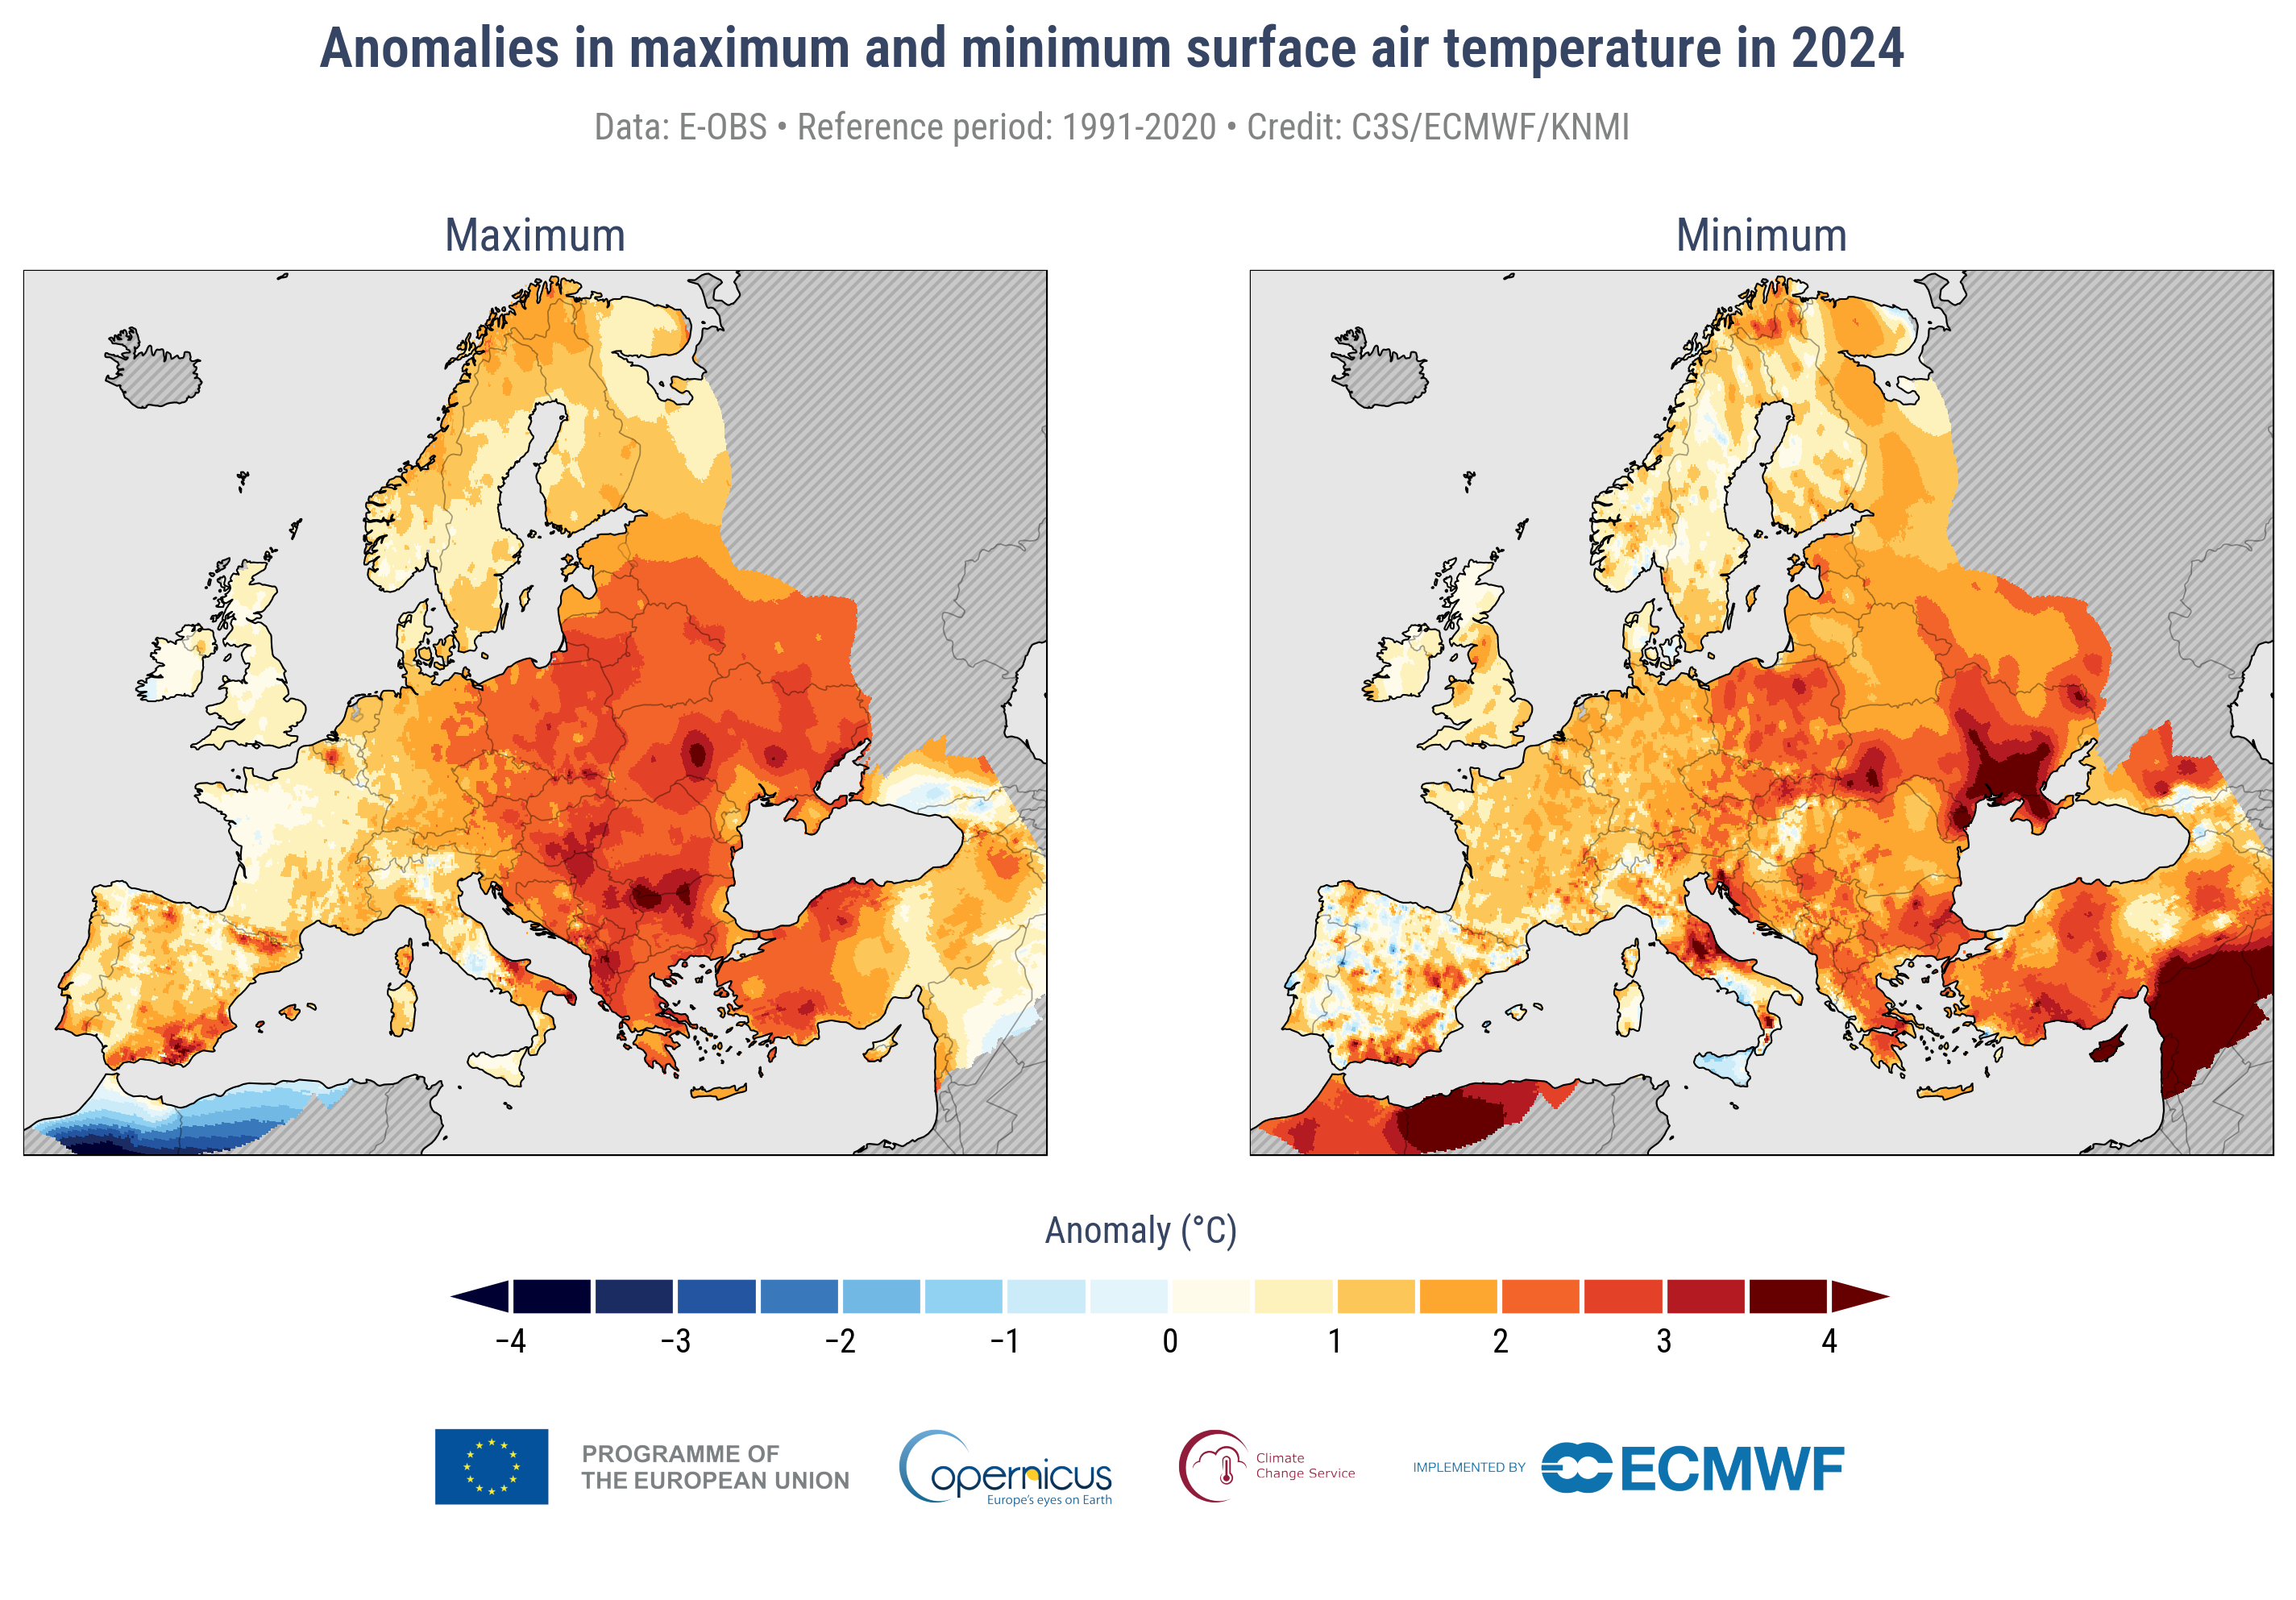
(Source: Copernicus Climate Change Service/ECMWF/KNMI, 2024)
Figure above (Copernicus, 2024) compares maximum and minimum daily temperatures. It highlights that southeastern Europe — including Romania — not only faces hotter daytime extremes but also warmer nights, echoing exactly what my local TR20 analysis found. Nights are not cooling the way they used to, locking in heat and stress.
You can find some materials on this topic here European State of the Climate 2024.
What This Means for the Future
If the current trajectory continues unchecked, by the 2040s Romanian summers could feel much closer to those of southern Greece or western Turkey. That means:
- Tropical nights will be normal.
- Air conditioning will shift from luxury to infrastructure, especially in schools, hospitals, and homes.
- Urban planning will need to change — more shading, trees, and cooling spaces.
- Agriculture will need to adapt, with heat-tolerant crops and irrigation strategies.
🔮 For the Technical: What These Projections Mean
- These are extrapolations, not climate model simulations.
- They assume today’s warming rates continue without major policy or technological shifts.
- Reality may diverge — faster if feedback loops kick in, slower if strong climate action is taken.
For someone like me, who dislikes sleeping with AC, that future is uncomfortable. For those growing up now, it will simply be their baseline.
From Doubt to Data
Looking back, my childhood memories weren’t false. They were accurate. And they marked the end of an era. The data proves what every Romanian already suspects: summers have changed — hotter, longer, more punishing.
Media stories help bring attention to climate change in Romania. By adding open Copernicus data into the mix, we can deepen the picture and see not just what happened last year, but how it fits into 60 years of change.
The value isn’t in telling people what to do about it. The value is in confirming that our intuitions are correct, our memories are reliable, and the change is real, measurable, and dramatic.
Technical details & references
For those that are more interested in the “how-to” of the analysis, I’ve added some references and details of the approach and what tools have I used to perform the analysis. It’s structured across three areas:
- data loading
- data analysis
- visual representation
Here is the doc below, I’d love some feedback.
Discover more from Liviu Nastasa
Subscribe to get the latest posts sent to your email.
