A lot of people start their year with new powerful resolutions, ambitious goals and objectives .. some of them (not that many I’d say) start a year-long project, something that can’t be rushed and develops with the year, something that needs constant care. If someone would have started a conversation like this with me and ask me to pick a project to fit the description I wouldn’t have thought of … a temperature blanket for the current year.
The concept is simple (with variations) – you get the daily temperature for each day of the year and create “an entry” in your crochet, a line usually, but that could be also a square or a free shape. You can see more ideas here for example, some of them requiring a higher skill level to deliver, but you have plenty of options to try and play.
This is not my project, at least not initially .. but I was quickly co-opted by my wife because she asked me to provide the temperatures for the days in January, because she already opted for the 10 colours she will use to knit crochet the blanket.
Sure .. our son argued that Green is nowhere near a “warm” colour, while my wife considered green as being part of spring and associated with a 13 to 18 degrees Celsius, but that is just another opportunity to have a heated conversation with a 18 years old trying to have an impact.

The range of colours and temperature were decided by my wife, discarding the lower temperatures than -10 Celsius (you could use the same colour for everything below -6 Celsius as an option) but favouring the higher than + 43 Celsius which are even less known to happen than the negative 10…anyway, it was her project … then her choice.

I said “that’s easy, darling!” since I have installed 2 years ago a Raspberry Pi with a Pimoroni Enviro+ set of sensors outside to measure the air quality and one of the parameters measured is the temperature. So, the only thing I need to to is get an average of the temperatures collected in my QuestDB database …

You can’t go much more personal than this .. I mean, this is the temperature measured outside my house and will be converted into a warm nice blanket.
For those who do not have the weather station outside able to collect historical data, the solution is to find a weather platform which allows you to get/query the historical data. For me, since I used the Polar sport watches for a while and I knew they use OpenWeatherMap, it was simple to navigate to https://openweathermap.org to create an account to query the historical data I needed.
I sketched some Python code in Google Colab to fetch the data after creating an account with OpenWeatherMap
import pandas as pd
from datetime import datetime, timedelta
import os
import requests
from google.colab import userdata

from google.colab import drive
drive.mount('/content/drive')

# File path for the Parquet file
file_path = '/content/drive/My Drive/Colab Notebooks/weather_data.parquet'

# Try to load existing data
if os.path.exists(file_path):
    df_existing = pd.read_parquet(file_path)
else:
    df_existing = pd.DataFrame()


# Assuming the DataFrame has a 'date' column with dates in YYYY-MM-DD format
# If your DataFrame is empty or does not exist, start from the beginning of the year
if not df_existing.empty:
    # Find the latest date in the DataFrame
    latest_date = pd.to_datetime(df_existing['date']).max()
else:
    # Start from the beginning of the year if no data exists
    latest_date = datetime(datetime.now().year, 1, 1) - timedelta(days=1)

# End date is yesterday (to ensure completeness of daily data)
end_date = datetime.now() - timedelta(days=1)

# Generate the list of dates for which data needs to be fetched
date_list = [latest_date + timedelta(days=x) for x in range(1, (end_date - latest_date).days + 1)]


def date_exists(df, date):
    """Check if the given date exists in the DataFrame's 'date' column."""
    return pd.to_datetime(df['date']).dt.date.eq(date.date()).any()


# OpenWeather API Key and location details
api_key = userdata.get("openweatherkey")
latitude = 44.56  # Otopeni latitude
longitude = 26.08  # Otopeni longitude

# Base URL for daily weather data
base_url = "https://api.openweathermap.org/data/3.0/onecall/day_summary"


# Assuming api_key, latitude, and longitude are defined as before
# Assuming base_url is defined as before

new_data = []

print("Prepare to have " + str(len(date_list)) + " requests to OpenWeather")

for single_date in date_list:
    # Check if this date's data already exists
    if not df_existing.empty and date_exists(df_existing, single_date):
        continue  # Skip this date if data already exists

    formated_date = single_date.strftime('%Y-%m-%d')
    params = {
        'lat': latitude,
        'lon': longitude,
        'date': formated_date,
        'appid': api_key,
        'units': 'metric'  # or 'imperial'
    }

    response = requests.get(base_url, params=params)
    if response.status_code == 200:
        # Process and append the new data
        daily_summary = response.json()
        # Example: append a simplified representation of the daily data

        # print(daily_summary)

        # Extract max/min temperature for the day
        max_temp = daily_summary["temperature"]["max"]
        min_temp = daily_summary["temperature"]["min"]


        new_data.append({
            'date': single_date.strftime('%Y-%m-%d'),
            # Add other relevant data fields here, e.g., temperature, humidity
            # Ensure these fields match your existing DataFrame structure
            'max_temp': max_temp,
            'min_temp': min_temp,
        })
    else:
      print("Bad request:" + str(response.status_code))

# Only proceed if new data was fetched
if new_data:
    df_new = pd.DataFrame(new_data)
    # If the existing DataFrame is not empty, concatenate new data; otherwise, use new data directly
    if not df_existing.empty:
        df_combined = pd.concat([df_existing, df_new], ignore_index=True)
    else:
        df_combined = df_new

    # Remove duplicates just in case, based on the 'date' column
    df_combined.drop_duplicates(subset=['date'], keep='last', inplace=True)

    # Save updated DataFrame back to Parquet
    df_combined.to_parquet(file_path)
With that you could expect to collect all the data in a parquet file on your Google Drive for all the days until yesterday.
If you want to display the information, you have a simple option to play with matplotlib, but actually what’s important is the tabular format for the “end-user”.
import pandas as pd
import matplotlib.pyplot as plt
from google.colab import drive
drive.mount('/content/drive')
# Path to the Parquet file
file_path = '/content/drive/My Drive/Colab Notebooks/weather_data.parquet'
# Load the dataset
df = pd.read_parquet(file_path)
df['avg_temp'] = df[['min_temp', 'max_temp']].mean(axis=1)
# Set the figure size for better readability
plt.figure(figsize=(12, 6))
# Plot each temperature type
plt.plot(df['date'], df['min_temp'], label='Min Temperature', color='blue')
plt.plot(df['date'], df['max_temp'], label='Max Temperature', color='red')
plt.plot(df['date'], df['avg_temp'], label='Avg Temperature', color='green', linestyle='--')
# Adding labels for average temperatures
for i, avg_temp in enumerate(df['avg_temp']):
plt.text(df['date'][i], avg_temp + 0.5, # Adjust position as needed
f'{round(avg_temp)}°C',
ha='center', # Horizontal alignment
va='bottom', # Vertical alignment
color='green')
# Adding title and labels
plt.title('Daily Temperatures')
plt.xlabel('Date')
plt.ylabel('Temperature (°C)')
# Rotate date labels for better readability
plt.xticks(rotation=45)
# Add a legend
plt.legend()
# Show the plot
plt.tight_layout()
plt.show()
# Assuming 'df' is your DataFrame with 'date', 'min_temp', 'max_temp', and 'avg_temp' columns
# print(df[['date', 'min_temp', 'max_temp', 'avg_temp']].round(0))
# Round 'avg_temp' to integer and keep 'min_temp' and 'max_temp' with two decimals
df['min_temp'] = df['min_temp'].round(2)
df['max_temp'] = df['max_temp'].round(2)
df['avg_temp'] = df['avg_temp'].round(0).astype(int) # Convert to int for removing decimal point
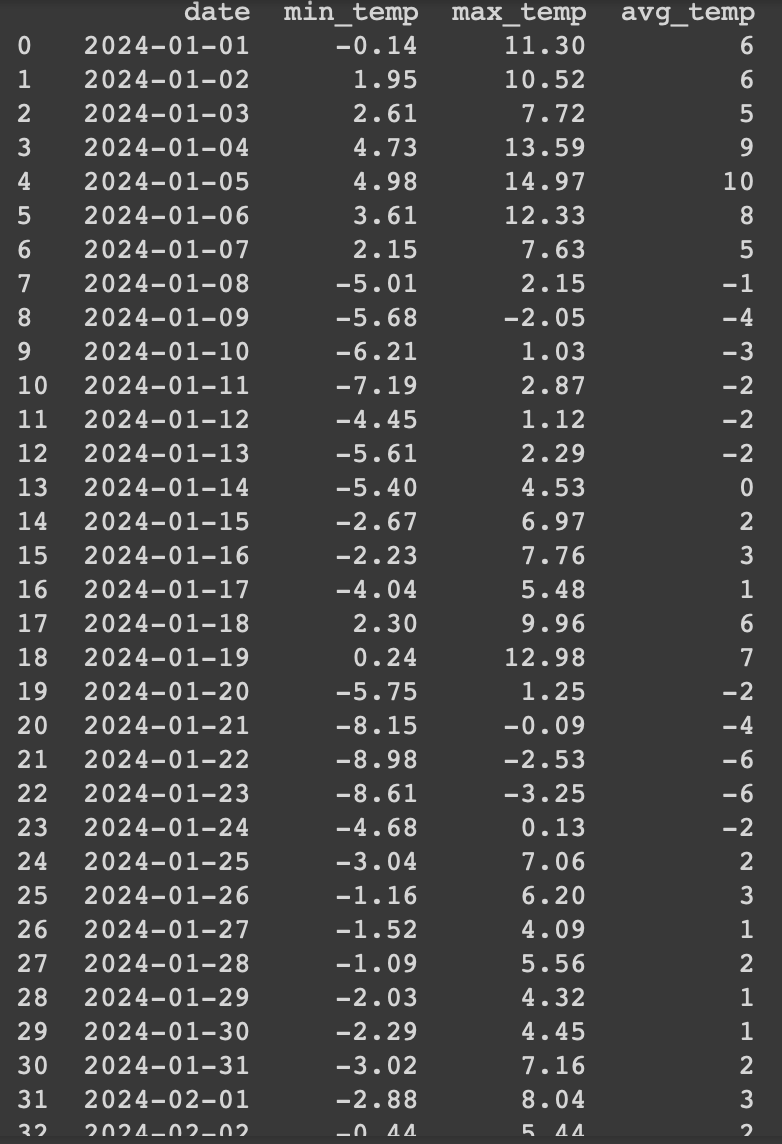
print(df[['date', 'min_temp', 'max_temp', 'avg_temp']])The results are easy to see ..

Sure, the graph (in this format) is useful for a small series and needs some tweaks for larger sets of data, but it was only just for me to view the evolution for the data I collected so far.
To improve the user experience, I should convert the average temperature into a colour that should be used by my wife for her knitting, starting with her choices of colours and “agreed” ranges.
def map_temp_to_color(avg_temp):
    temp_ranges = [(-10, -6, 'unt'), (-5, 0, 'bleu'), (1, 6, 'gri'),
                   (7, 12, 'roz161'), (13, 18, 'verde'), (19, 24, 'roz798'),
                   (25, 30, 'portocaliu'), (31, 36, 'mustar'),
                   (37, 42, 'caramiziu'), (43, 50, 'grena')]

    for temp_range in temp_ranges:
        if temp_range[0] <= avg_temp <= temp_range[1]:
            return temp_range[2]
    return "N/A"  # Default case if the temperature doesn't match any range
Then the code to display the information in the tabular format changes to:
# Assuming 'df' is your DataFrame with the 'avg_temp' column
df['color'] = df['avg_temp'].apply(map_temp_to_color)

# Adjusting DataFrame formatting for display
df_formatted = df.copy()
df_formatted['min_temp'] = df['min_temp'].map('{:.2f}'.format)
df_formatted['max_temp'] = df['max_temp'].map('{:.2f}'.format)
df_formatted['avg_temp'] = df['avg_temp'].round(0).astype(int).map('{}°C'.format)

# Display the DataFrame as a table
print(df_formatted[['date', 'min_temp', 'max_temp', 'avg_temp', 'color']].to_string(index=False))
The result is more useful for someone who doesn’t want to look over the “color mapping table”

The next step would be to create a visual guide for all days with the colours my wife selected for the temperature blanket, but for now I feel today’s projects looks decent and I earned the right for one of the muffins she is baking now.
If someone wants to skip the learning process of using python and pandas to manipulate the data collected from OpenWeatherMap (or other similar services), I noticed that there was enough interest about temperature blankets to create a website serving you will all the data you need to create your blanket – https://temperature-blanket.com.
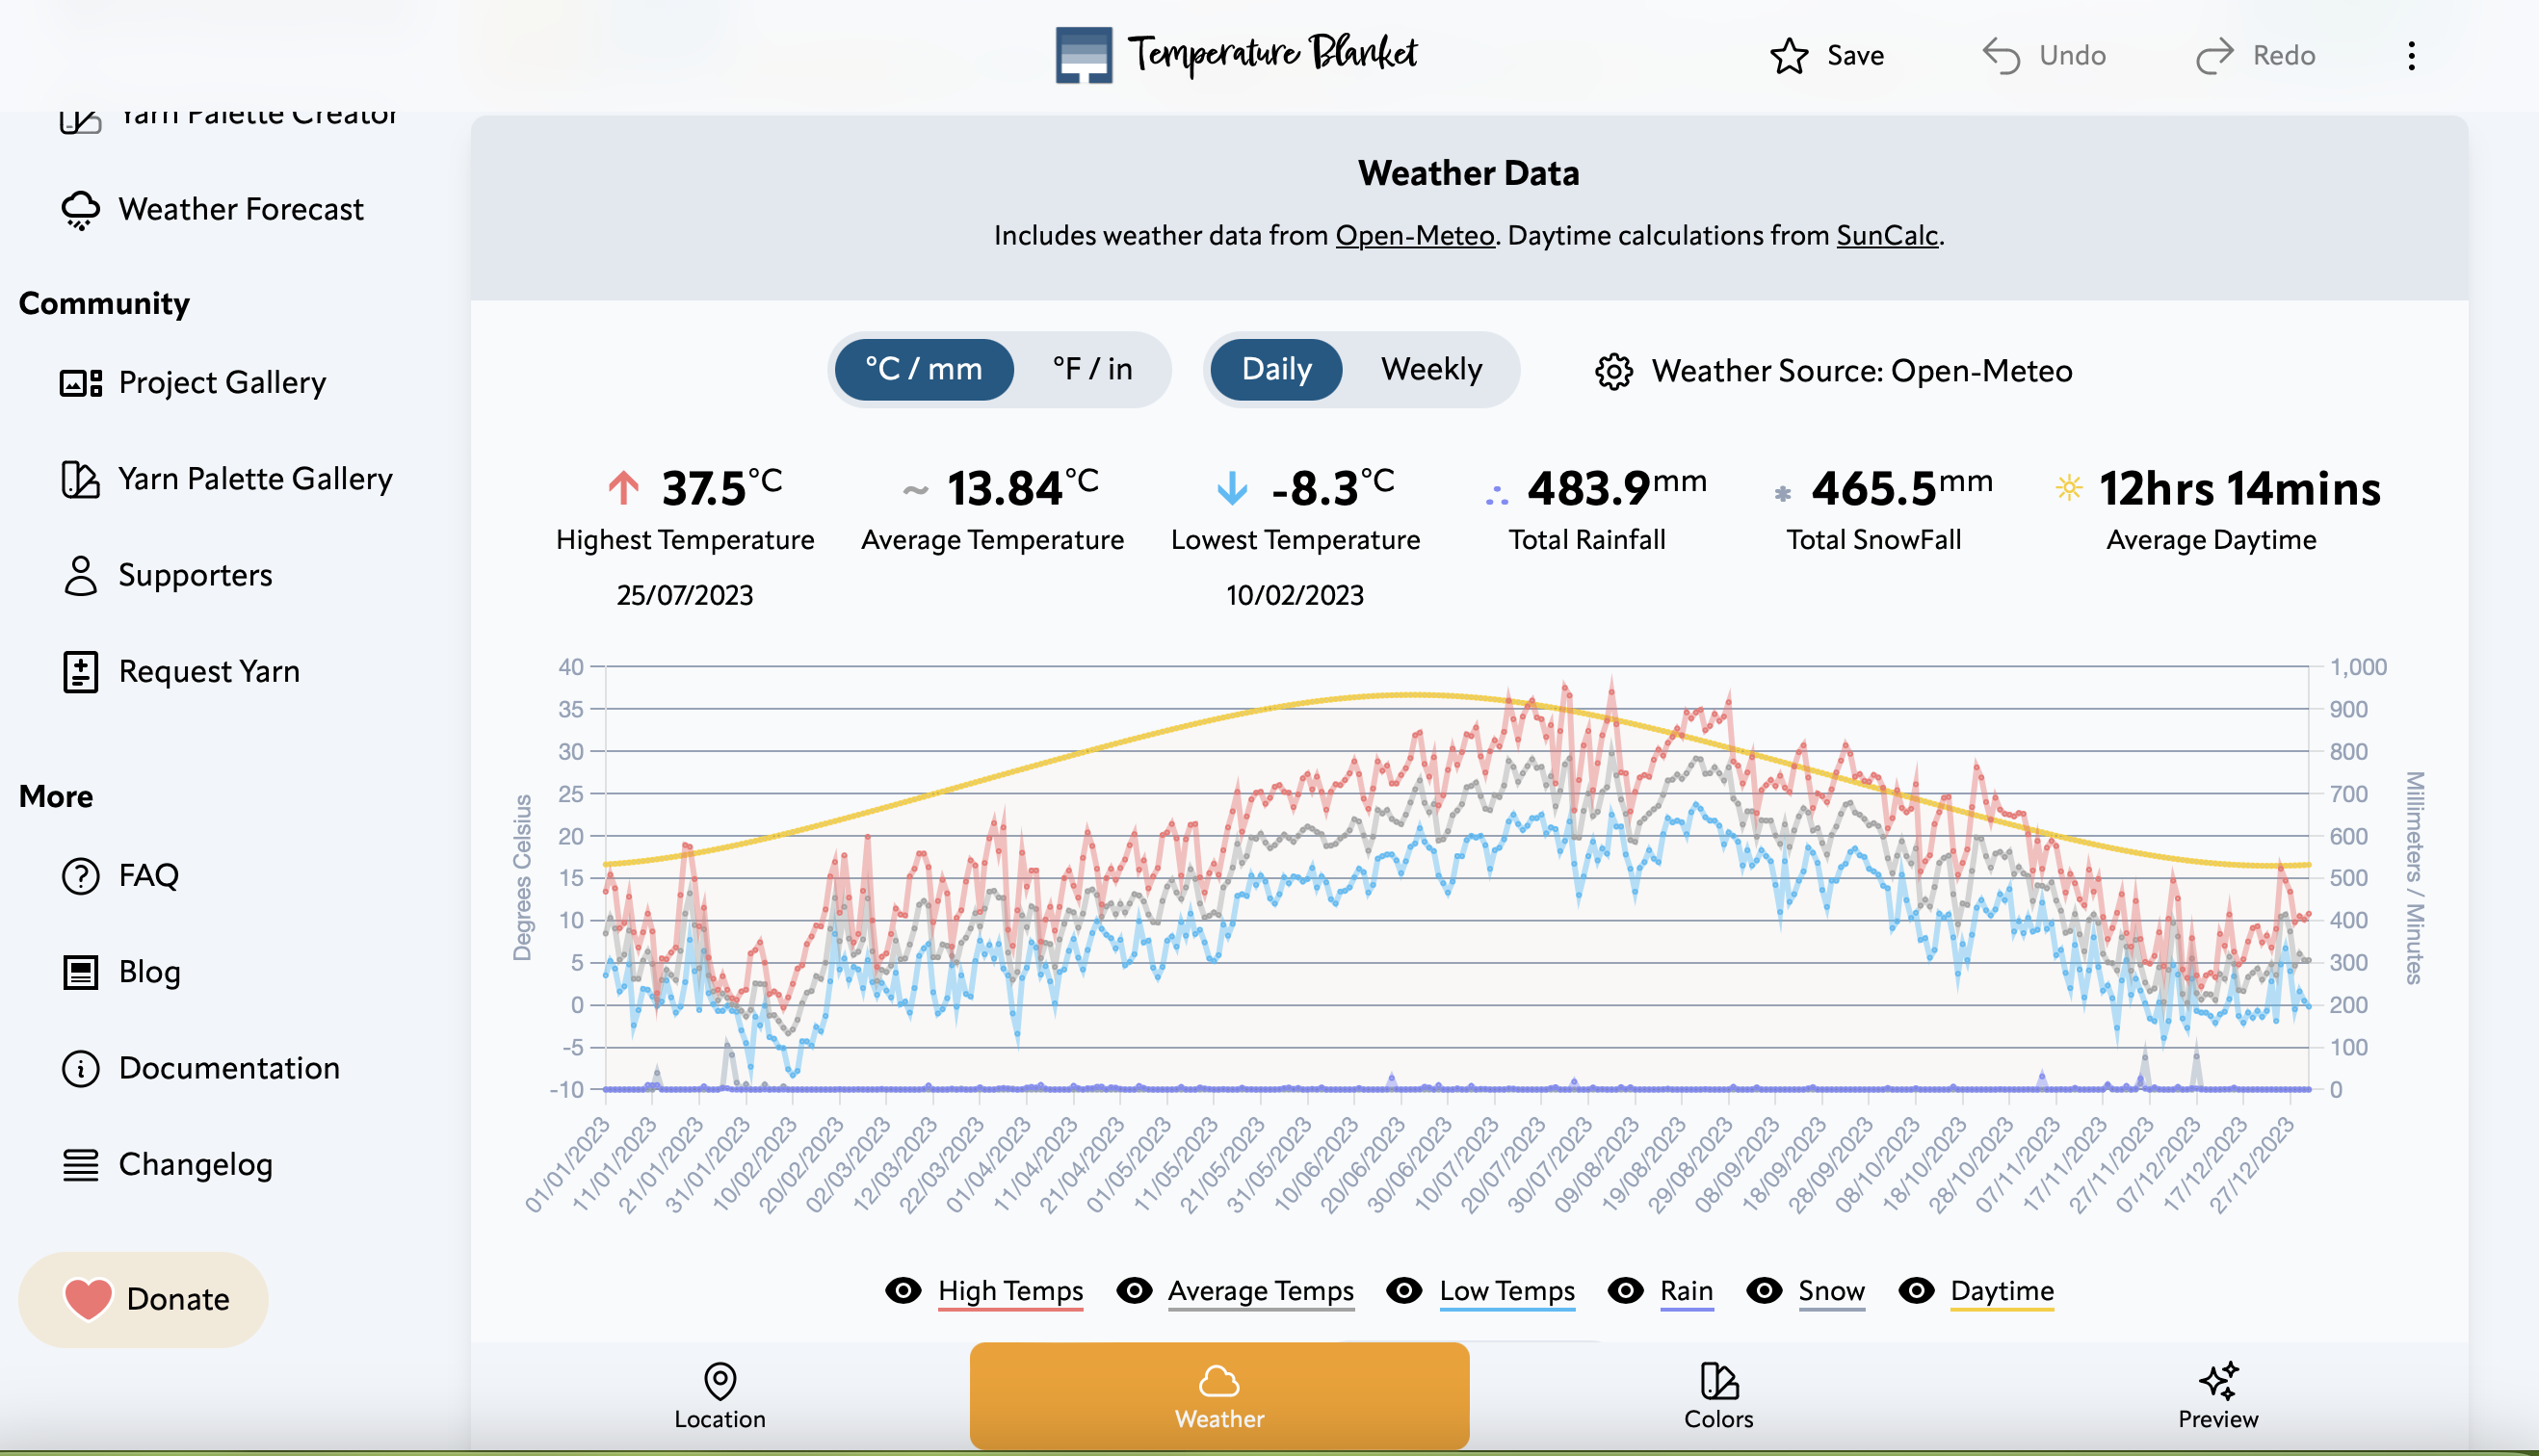
You can have access to the data from 2024 and download it in a CSV format to play with it.


At the same time, it was (more) fun and I would always (most of the time) pick an opportunity to learn and do something cool and I would encourage people to find nice projects to learn from – small or big – that keeps them alive.
Enjoy life long learning and grow playing!
Discover more from Liviu Nastasa
Subscribe to get the latest posts sent to your email.
